Website monitoring for SaaS companies
It's a Tuesday standup and someone from marketing mentions that your biggest competitor just dropped their per-seat pricing. They saw it on Twitter. Your PM opens the competitor's pricing page, but the old layout is already gone. Nobody saved it. Nobody can say exactly when the change happened, what the previous tiers looked like, or whether the feature packaging shifted too. The thread drifts into speculation, and the only thing anyone agrees on is that someone should have been watching. SaaS competitor monitoring would have caught it automatically. But nobody had set it up.
This happens in SaaS more weeks than not. Competitors update pricing pages, rewrite positioning, launch features, and rework onboarding flows without announcements. By the time your team notices, the previous version is gone. Website monitoring for SaaS companies isn't about catching outages (that's what Datadog and UptimeRobot handle). It's about capturing what your competitors and your own product pages actually say, day by day, so you have a record when decisions need to be made.
Why SaaS companies need website monitoring that goes beyond uptime
Most SaaS teams already monitor uptime and performance. That's table stakes. What they don't monitor is the content on the pages that drive revenue and competitive positioning. A competitor changes their pricing structure, bundles AI into every tier, or kills a standalone add-on, and your team finds out days or weeks later through secondhand sources.
The cost of that delay is real. When Notion folded their AI add-on into the base plan in late 2024, competing note-taking apps had a narrow window to reposition before the narrative settled. Teams that caught the change early could adjust messaging and pricing within days. Teams that found out through a TechCrunch article were already behind.
Slack's forced AI bundling in August 2025 showed the same dynamic. The per-seat price jumped, and features that had been a separate add-on became part of the core package. For competing collaboration tools, that pricing shift was an opening: but only if you noticed it quickly enough to respond. Figma's pricing overhaul with AI credits followed the same pattern a few months later. In both cases, the old pricing page was simply gone the moment the new one went live, and anyone who hadn't archived it was left reconstructing details from memory.
These are strategic moves disguised as page updates. The details (which features moved between tiers, what usage limits changed, how the billing toggle works now) matter when your sales team is mid-deal and a prospect asks how you compare.

What SaaS teams actually monitor beyond pricing pages
Pricing pages get the most attention, and for good reason. But once teams start monitoring, the list expands beyond pricing pretty quickly.
Your competitors' changelogs are surprisingly honest. A release note like "improved collaboration features" might mean real-time editing, or it might mean they fixed a bug. Either way, the pattern of updates over weeks reveals their product roadmap more reliably than any analyst report. Monitoring changelogs with scheduled screenshots means you never miss a release, even when nobody on your team happened to check that week.
Nobody puts out a press release when they deprecate an API endpoint. But when a competitor drops a legacy integration or adds a new category to their docs, that's a product decision with real effects on their partner ecosystem. These changes show up in the documentation before anywhere else, and change detection (pixel-level comparison that flags differences between captures) catches them automatically.
Integration and marketplace pages follow a similar logic. If a competitor suddenly adds five new CRM integrations, that tells you which market segment they're chasing. These pages tend to change incrementally, which makes them easy to miss manually but straightforward to track.
Then there are the less obvious signals. Monitoring a competitor's status page doesn't just tell you about their uptime: it tells you how they communicate during incidents, how often they have them, and whether their infrastructure problems create an opening for your sales team. Ten new machine learning engineer postings on a competitor's careers page tell you where they're investing, months before the product shows up. A hiring freeze on their sales team might signal a pivot. This is the kind of signal that competitive intelligence analysts at SaaS companies track systematically, and automated captures make it repeatable rather than anecdotal.
SaaS pricing monitoring without building a scraper
SaaS pricing monitoring deserves special attention because it's where the stakes are highest and the details are most granular. A tier renamed, a feature moved between plans, a usage limit quietly adjusted, these changes affect how your sales team positions against a competitor in every deal.
The instinct is to build a scraper or assign someone to check competitor pricing pages weekly. Scrapers break when page structures change (which, for pricing pages, happens often). Manual checks are sporadic and produce no historical record. Screenshot-based monitoring captures the page exactly as a visitor would see it, on whatever schedule you set, with a visual record you can scroll through later.
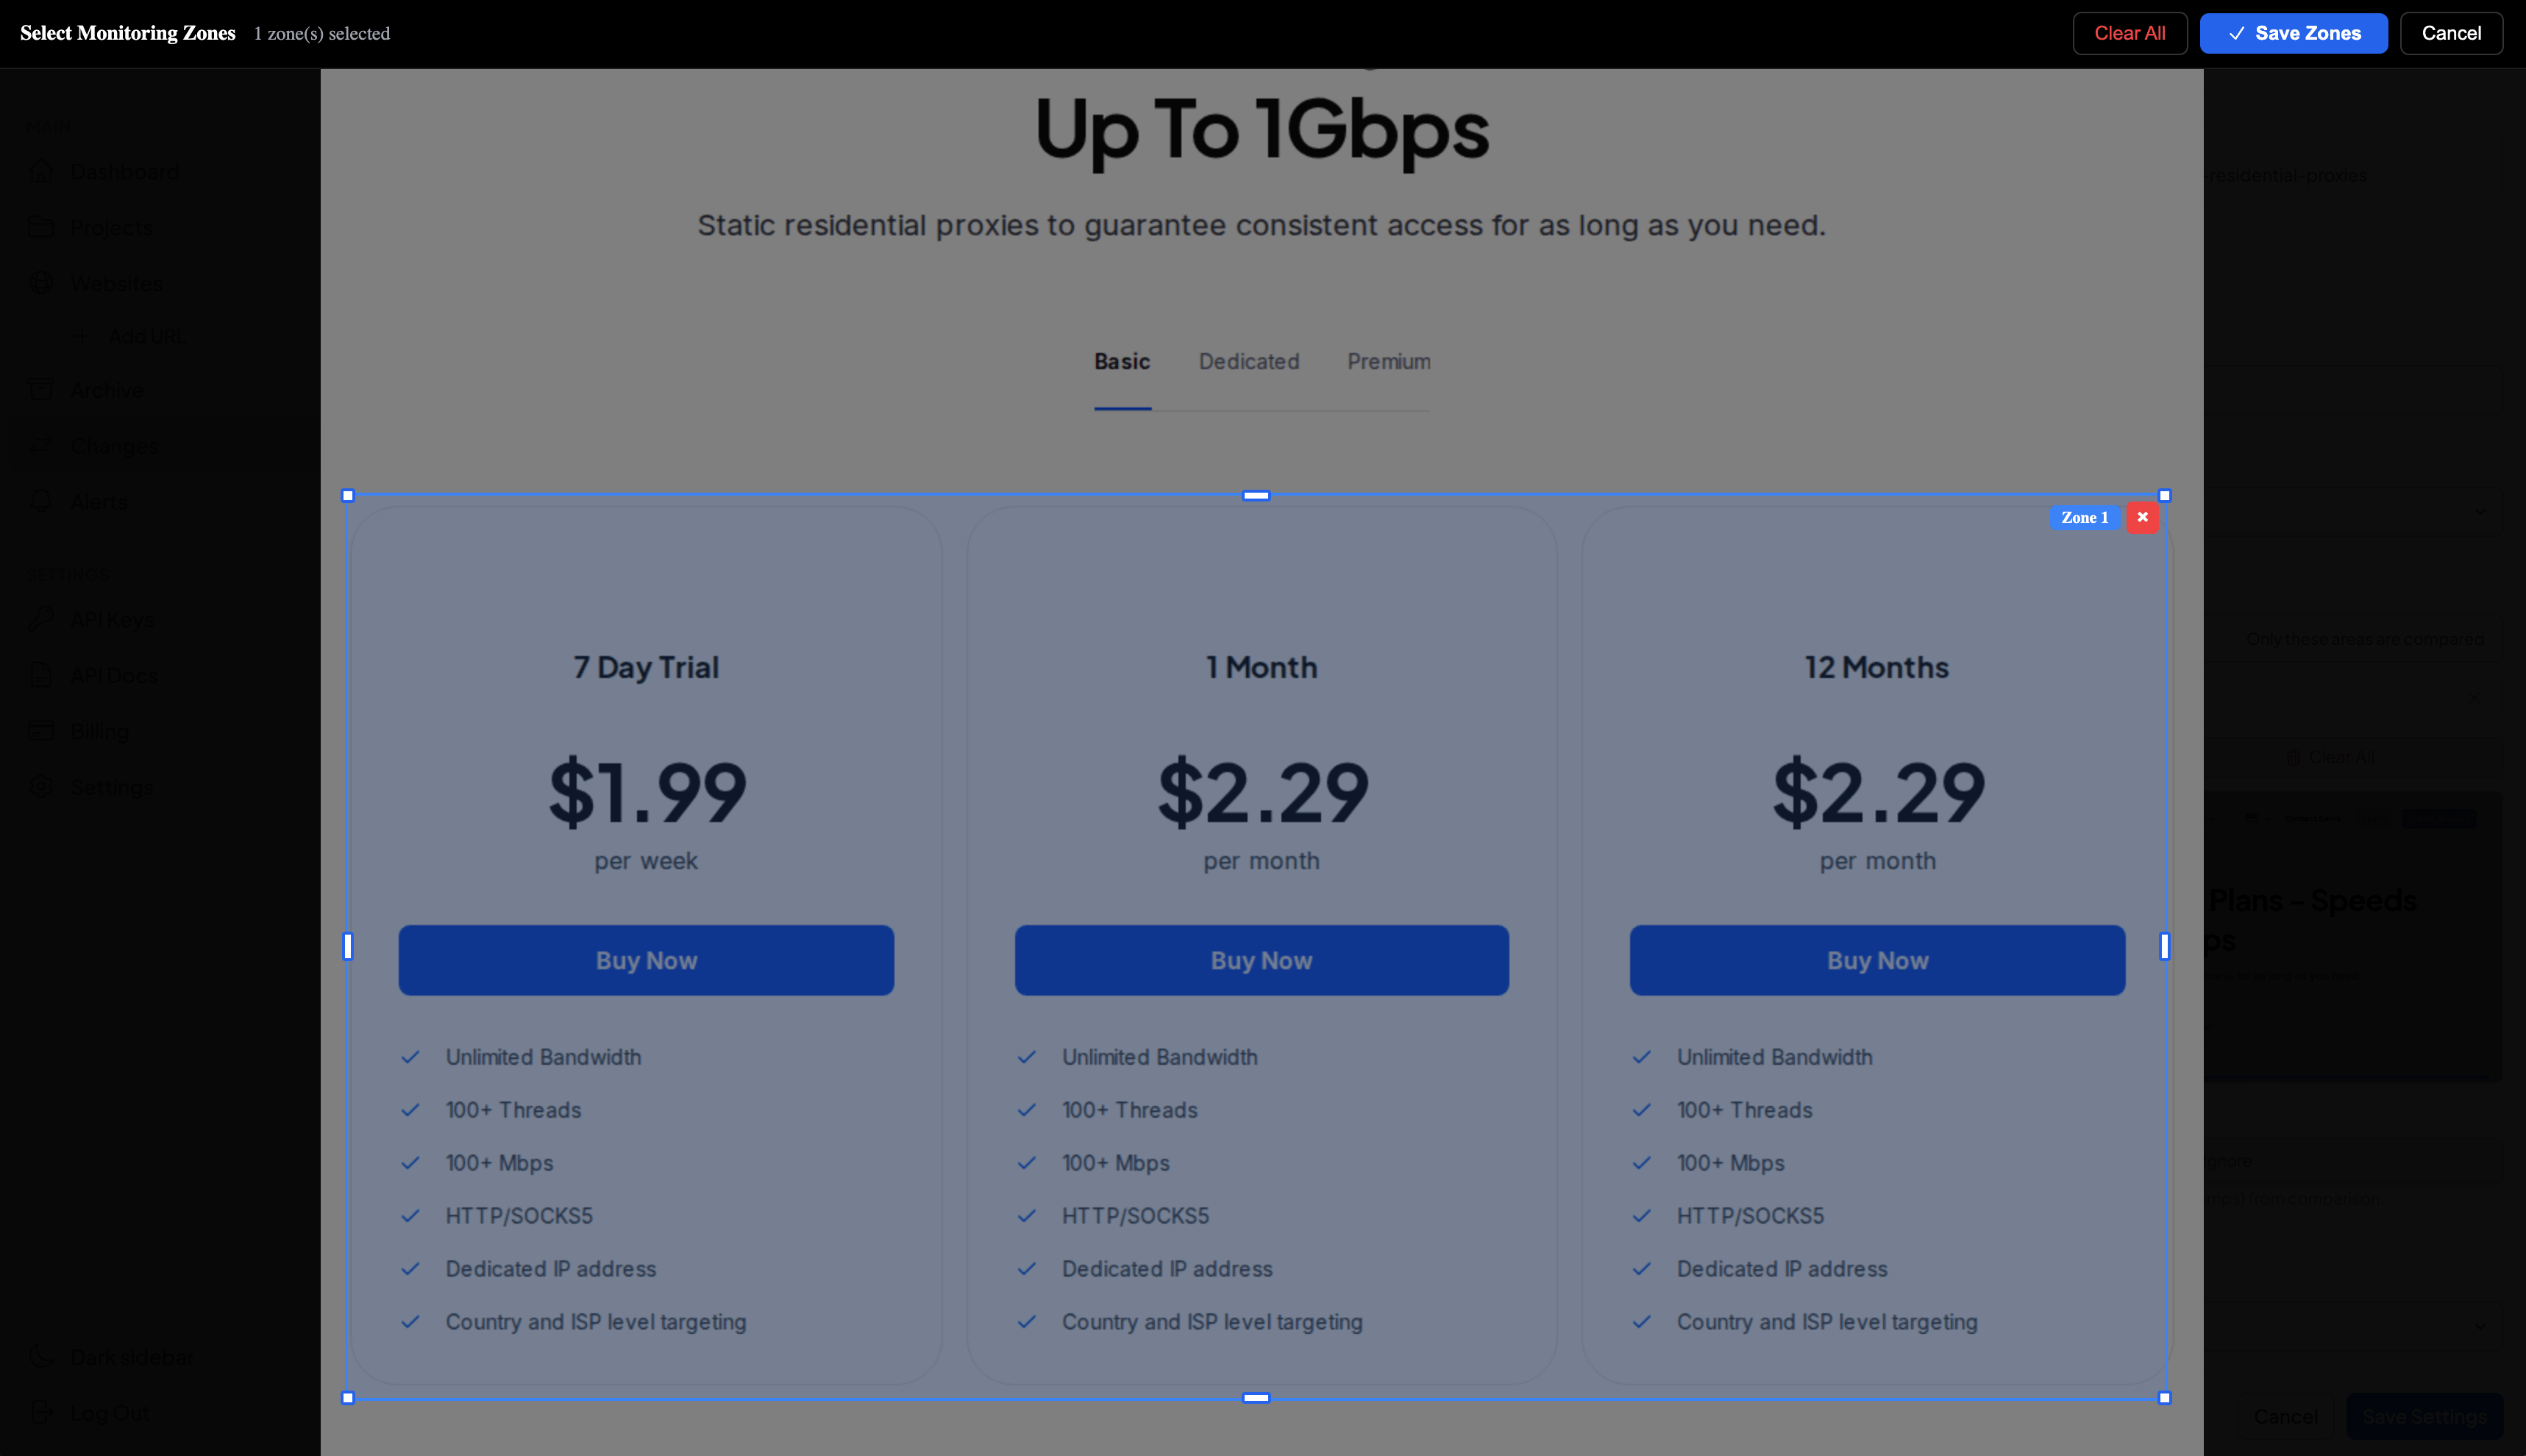
We wrote a detailed guide on tracking SaaS pricing page changes that covers the specific workflow, including how to use clip-to-element (a feature that captures only a specific section of a page rather than the full viewport) to focus on the pricing table itself and avoid false positives from rotating testimonials or header banners. The price monitoring use case page covers the broader workflow if you're monitoring across multiple competitors.
Tracking SaaS competitor launches and positioning shifts
Pricing changes are usually one-time events with clear before-and-after states. Positioning shifts are subtler. A competitor might gradually rewrite their homepage over several weeks, moving from "project management" to "work management" to "enterprise work platform." Each individual change is minor. The cumulative shift tells a story about where they're headed.
How do you even track something that gradual? The Paddle landing page redesign is a good example. Over several months, Paddle's homepage evolved from a developer-focused payment infrastructure pitch to a broader merchant-of-record positioning. The screenshots captured daily show the progression clearly. Individual changes that, viewed in isolation, seem like routine A/B testing, but together reveal a deliberate strategic pivot. We documented the full timeline in our Paddle landing page redesign case study.
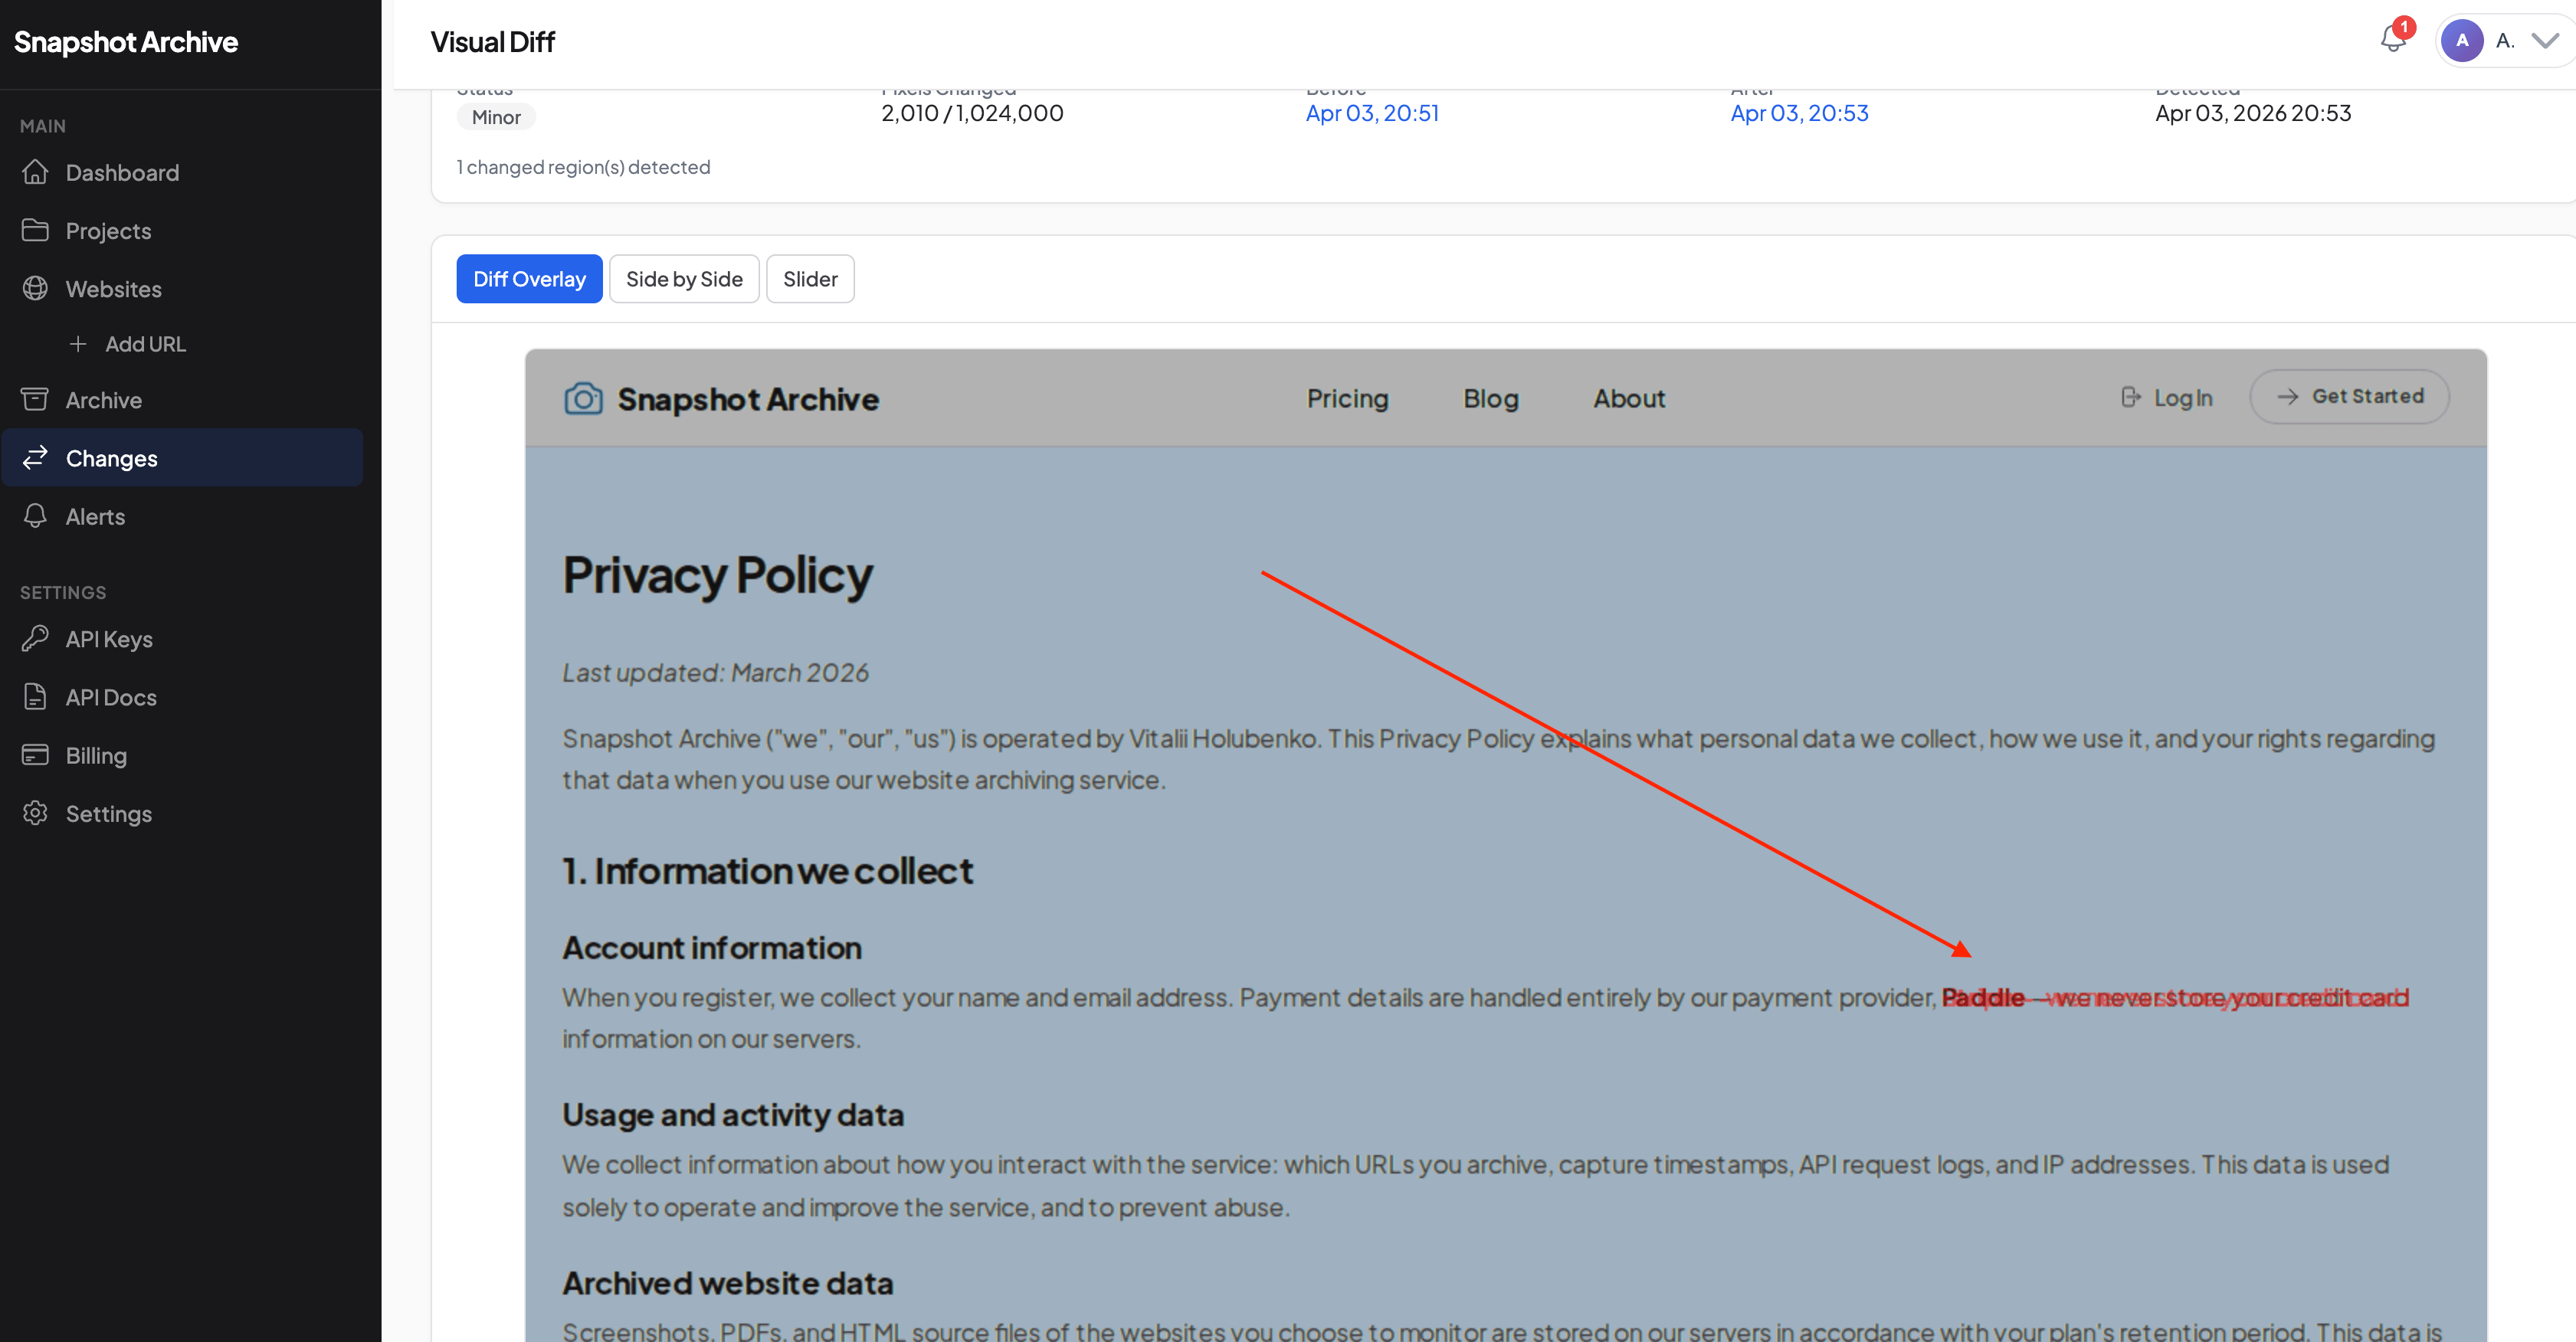
Visual diff makes this kind of analysis practical. Instead of comparing two screenshots by squinting at them, the overlay highlights exactly which elements changed. Text edits, image swaps, layout shifts, and new sections all show up in the comparison. Our visual diff explainer covers how the pixel comparison works and what the different modes (overlay, side-by-side, slider) are best suited for.
For competitive intelligence teams at SaaS companies, the real value isn't just catching individual changes. It's having an archive of how competitors present themselves over time. When your CEO asks "how has Competitor X's messaging changed in the last six months," you can pull up the archive instead of shrugging.
Monitoring your own SaaS product pages after deployment
Competitive monitoring gets most of the attention, but some of the most practical use cases are internal. After a deployment, things break in ways that automated tests don't catch. A CSS change makes the pricing toggle invisible on mobile. A CMS update swaps two feature descriptions. A third-party script (chat widget, analytics pixel) loads differently and pushes content below the fold.
Post-deployment visual monitoring catches these problems the way a user would: by looking at the page. Set up full-page screenshots of your critical pages (pricing, signup, feature pages, landing pages tied to active ad campaigns) and capture them before and after each deploy. When something looks wrong, the visual diff shows you exactly what shifted.
This isn't a replacement for end-to-end testing or synthetic monitoring. It's a complement. Selenium tests check whether a button is clickable. Website monitoring for SaaS teams checks whether the page looks right to a human. We covered the specific workflow in post-deployment monitoring, including how teams set up capture schedules around their release cycles.
Growth teams find this especially useful for landing pages tied to paid campaigns. If a page changes unexpectedly and conversion drops, having a visual record of exactly when and what changed saves hours of digging through deploy logs trying to reconstruct what happened.
What a five-competitor monitoring setup looks like for a SaaS product team
Each competitor gets its own project. Inside each project, you'd typically monitor the homepage, pricing page, main feature pages (three to five per competitor), changelog or what's-new page, and one or two additional pages like their integrations directory or API docs. That's roughly 8 to 12 URLs per competitor, so 30 to 60 URLs for a five-competitor setup.
Pricing pages get daily captures, because changes there are high-impact and time-sensitive. Homepages and feature pages work well on a two- or three-day cycle, since positioning shifts tend to happen gradually. Changelogs can run weekly unless a competitor is shipping rapidly. The which competitor pages to monitor guide covers frequency recommendations in more detail.
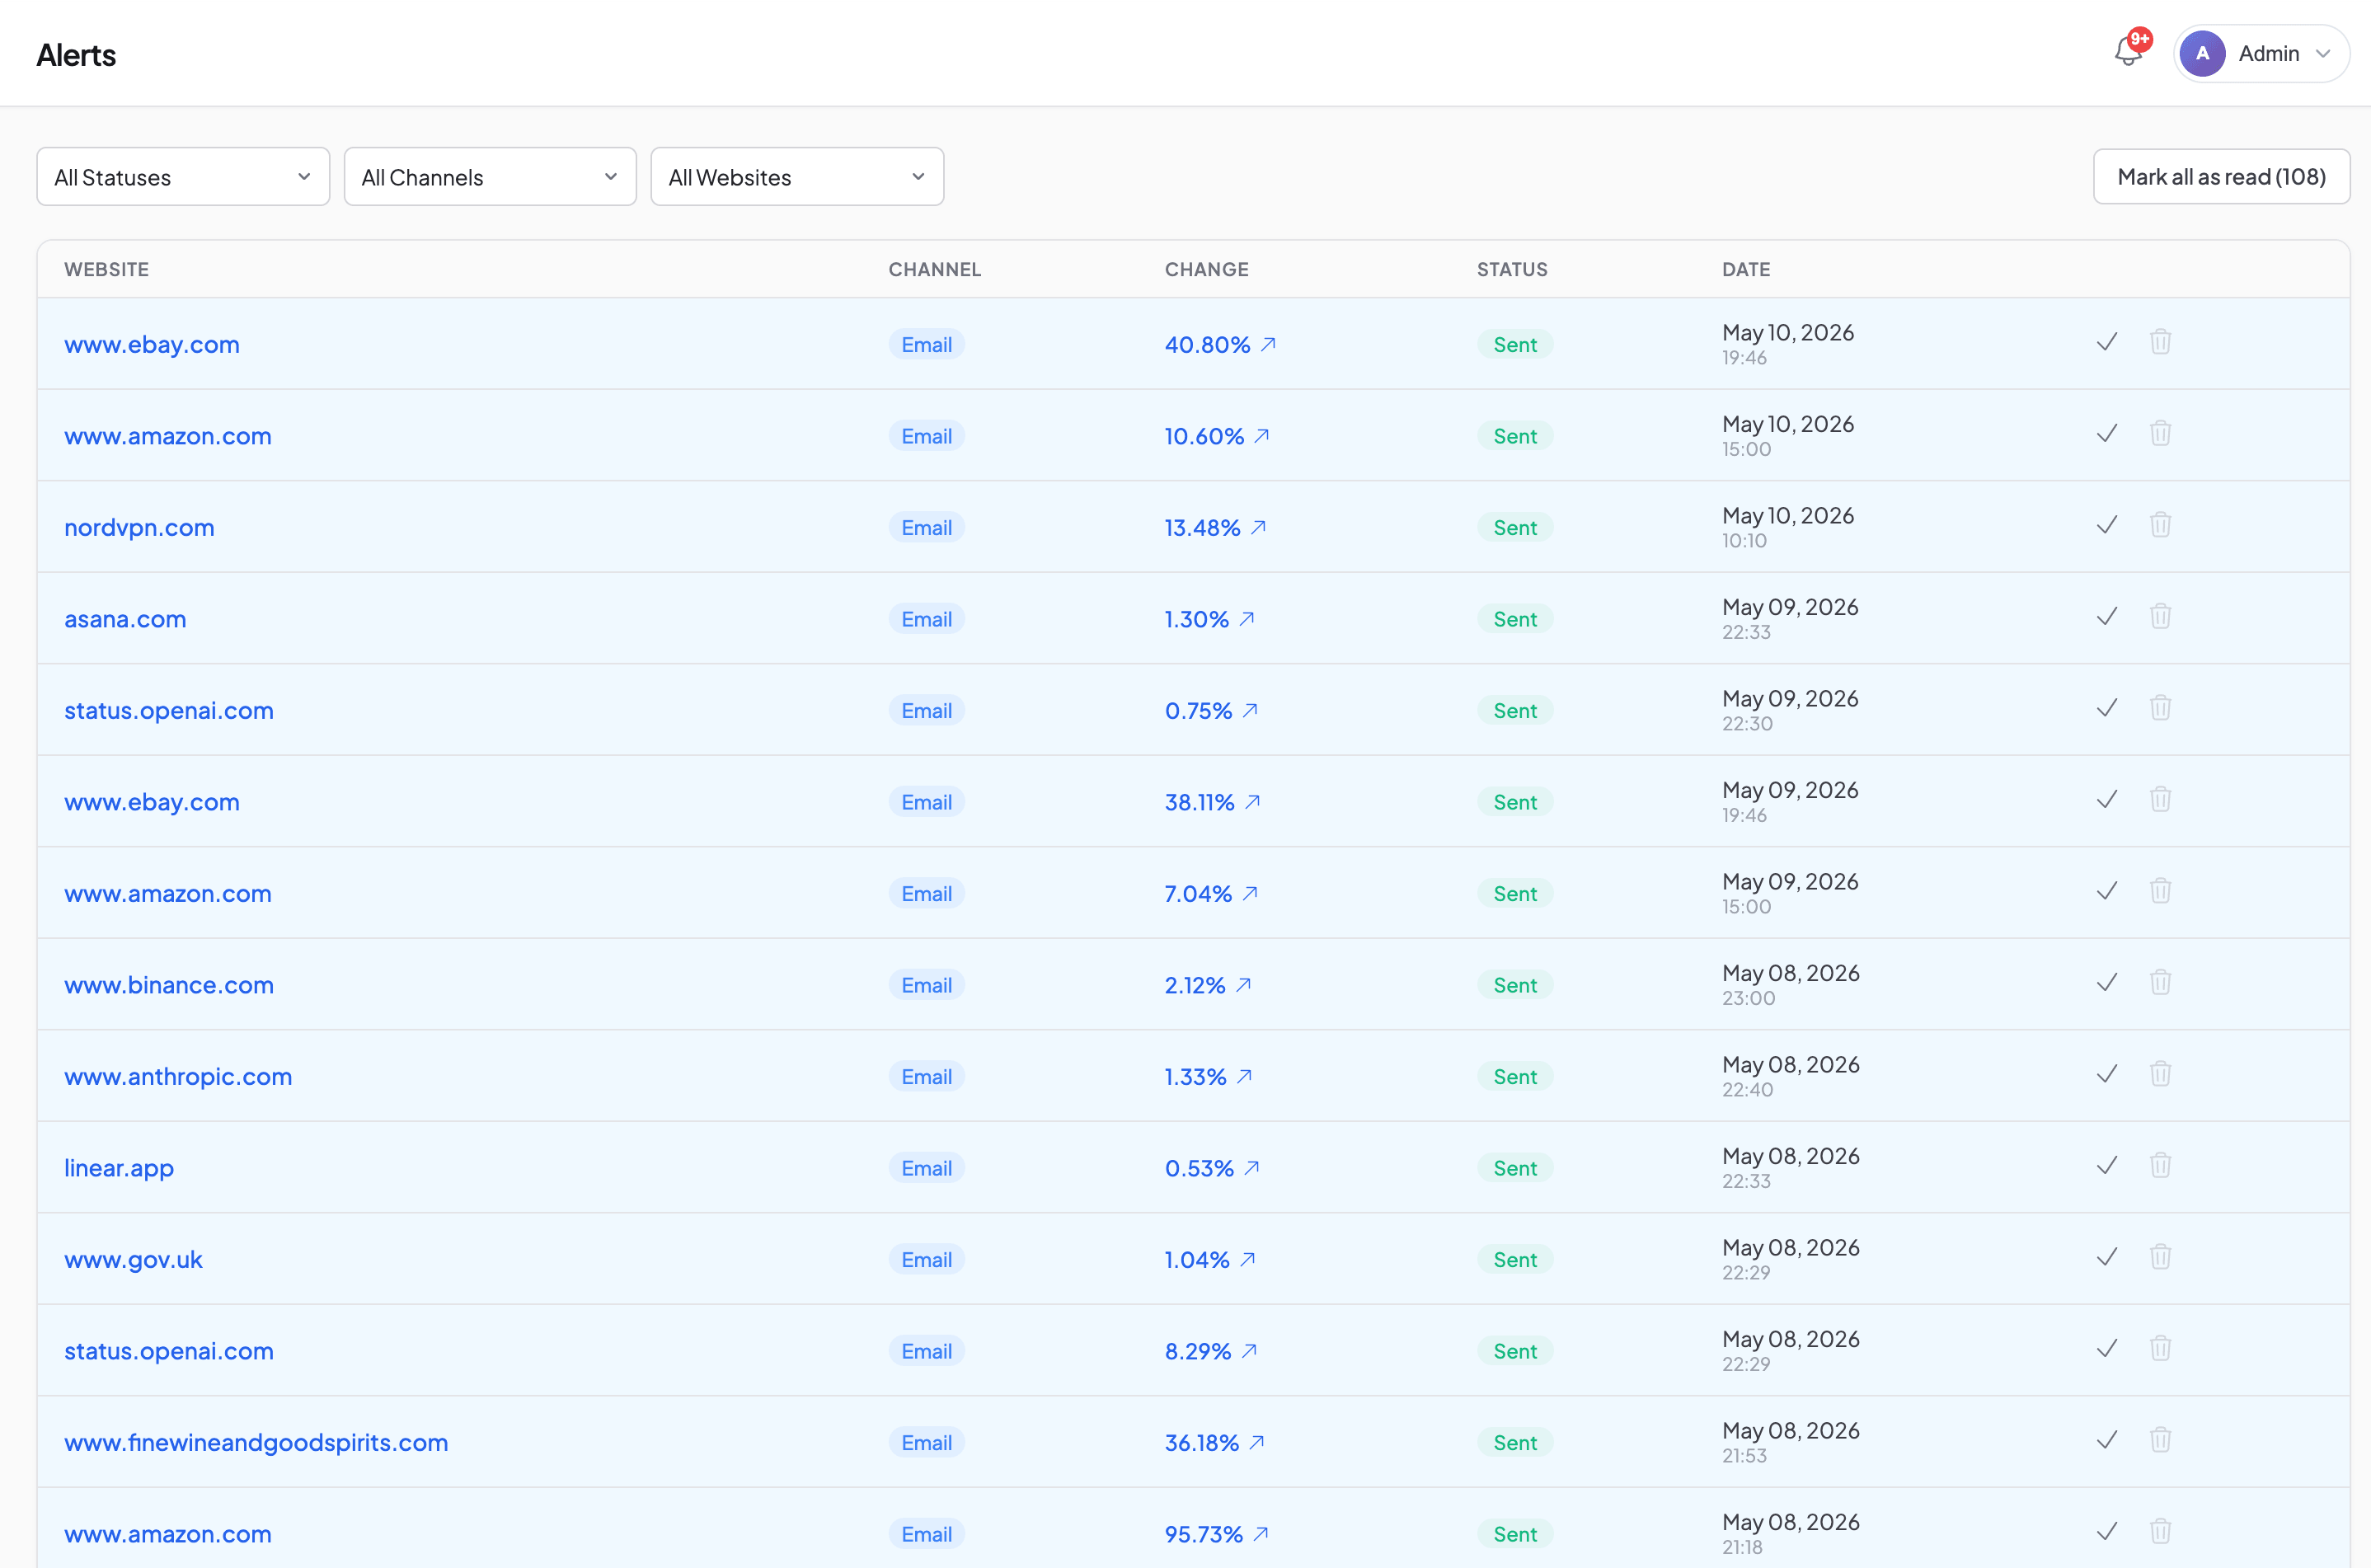
Change alerts go to whoever owns competitive intelligence. Sometimes a product manager, sometimes a dedicated analyst, sometimes a marketing lead. Setting the severity to moderate filters out the noise from cookie banner rotations and minor layout shifts while catching actual content changes. If a monitored pricing page triggers too many false alerts (common with pages that rotate customer logos or testimonials), our false positives guide walks through the fixes, including clipping to the specific section you care about.
For teams with engineering resources, the screenshot API opens up additional workflows. Some teams trigger captures programmatically after detecting a competitor deploy, and others pull archived screenshots into internal dashboards or Notion databases for broader visibility.
What screenshot monitoring doesn't replace in your SaaS toolkit
Let's be direct about the boundaries. Screenshot monitoring captures visual snapshots of web pages. It doesn't extract structured data, run JavaScript interactions, or log into gated areas. If you need to track a competitor's in-app experience behind a login wall, you'll need a dedicated account and manual review (or a tool designed for that, like Klue or Crayon).
If you need actual dollar amounts in a spreadsheet, you need a scraper or a manual process. Screenshot monitoring gives you the visual record and change detection, but it doesn't parse numbers out of the page. Honestly, most teams don't need structured extraction anyway: they need to see what changed and decide whether it matters. The competitive matrix can wait until someone reviews the captured screenshot.
Dynamic content that changes on every page load (personalized landing pages, geo-targeted pricing, A/B test variants) can generate false positives even with severity filtering. We're improving how we handle this, but it's a genuine limitation today.
Screenshot monitoring is not uptime monitoring, and it's not trying to be. If your competitor's site goes down, we'll capture an error page, which is technically a record but not the same as getting a Slack alert within 30 seconds. Uptime tools (Datadog, UptimeRobot, Better Uptime) do that job well. What we do is different: tracking what pages say, not whether they're online. Law firms and SaaS companies use this for different reasons, but the core capability is the same: a timestamped visual record that's already there when you need it.
How to test SaaS competitor monitoring with your top competitor
Pick the competitor your team talks about the most. Go to their pricing page and their main feature page. Add both URLs to Snapshot Archive on the free plan (three sites, 30-day retention, no card required). Set daily captures.
Within a week, you'll either catch a change you would have missed (which happens more often than people expect) or you'll confirm the page is more stable than you assumed. If the noise level is too high for that specific page, switching to clip-to-element to focus on the section that matters usually fixes it. All three outcomes tell you something useful.
From there, you can expand to more competitors, add your own product pages for post-deploy monitoring, and bring in the rest of your competitor monitoring setup. The whole process takes less time than one manual competitor review, and it runs in the background from then on.
Frequently Asked Questions
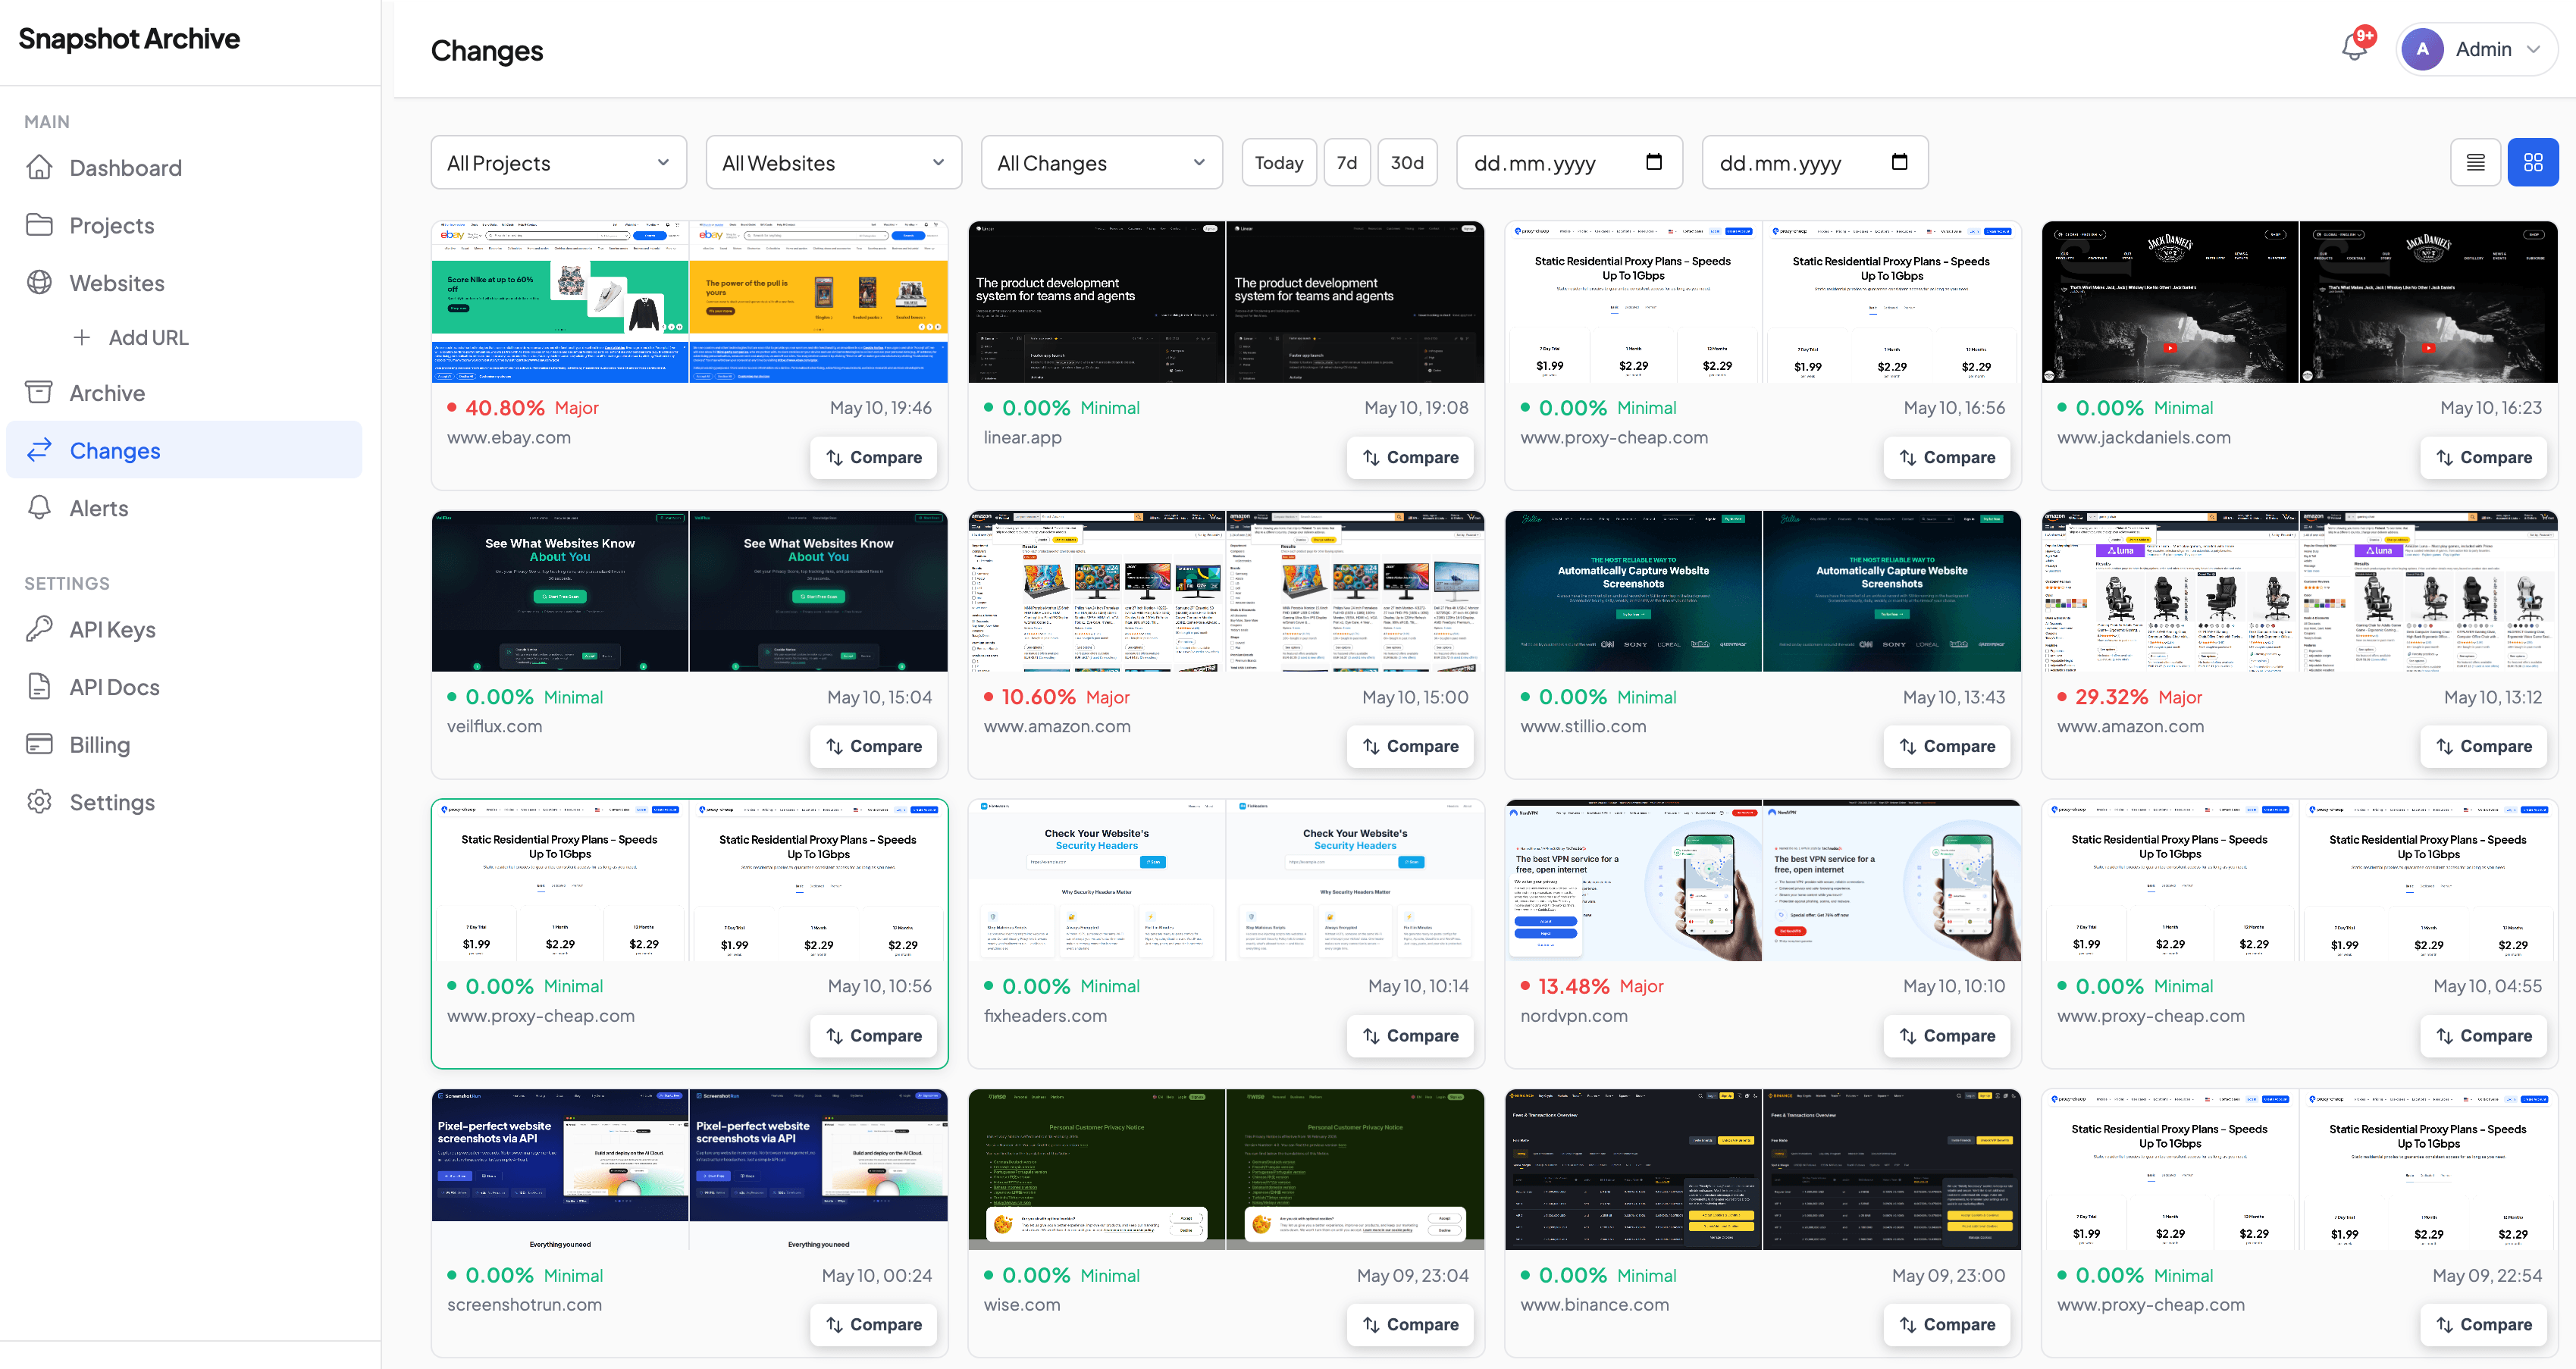
SaaS teams use automated screenshot monitoring to capture competitor pricing pages, feature pages, changelogs, and landing pages on a set schedule. When a page changes, visual diff highlights exactly what shifted, and change alerts notify the responsible team member by email, Slack, or webhook.
Yes. Scheduled screenshots capture competitor pricing pages daily or at any interval you set. Change detection compares each new capture against the previous one and flags differences. Clip-to-element targeting lets you focus on just the pricing table to avoid false positives from rotating banners or testimonials.
The most valuable pages to track are pricing pages, feature comparison tables, landing pages, changelogs and release notes, API documentation, integration directories, careers pages, and status pages. Pricing pages produce the highest-impact signals, while careers pages and changelogs reveal longer-term strategic direction.
Daily captures work best for pricing pages, where changes are high-impact and time-sensitive. Feature pages and homepages work well on a two- to three-day cycle. Changelogs and careers pages can run weekly unless a competitor is shipping rapidly or scaling their team.
No. Uptime monitoring tools like Datadog and UptimeRobot check whether a site is online and responding. Website monitoring for SaaS tracks what pages actually say — pricing tiers, feature lists, messaging, and visual layout. The two are complementary but solve different problems.
The most effective method is clip-to-element targeting, which captures only the specific section you care about rather than the full page. Setting severity thresholds to moderate filters out minor pixel-level shifts from cookie banners, ad rotations, and layout jitter. Hiding dynamic elements with CSS selectors also helps.
Visual change detection compares two screenshots pixel by pixel and highlights areas where the content differs. It works by overlaying captures taken at different times and flagging regions where pixels have changed beyond a set threshold. This catches text edits, image swaps, layout shifts, and new or removed sections.