Visual website availability monitoring with automated screenshots
Your uptime monitor says the site is up. HTTP 200, response time normal, all green. But the page is showing an error message, a maintenance banner, or a completely broken layout. Traditional uptime tools check if the server responds — they don't check what the page actually looks like. Website availability monitoring with screenshots exists to cover exactly that blind spot.
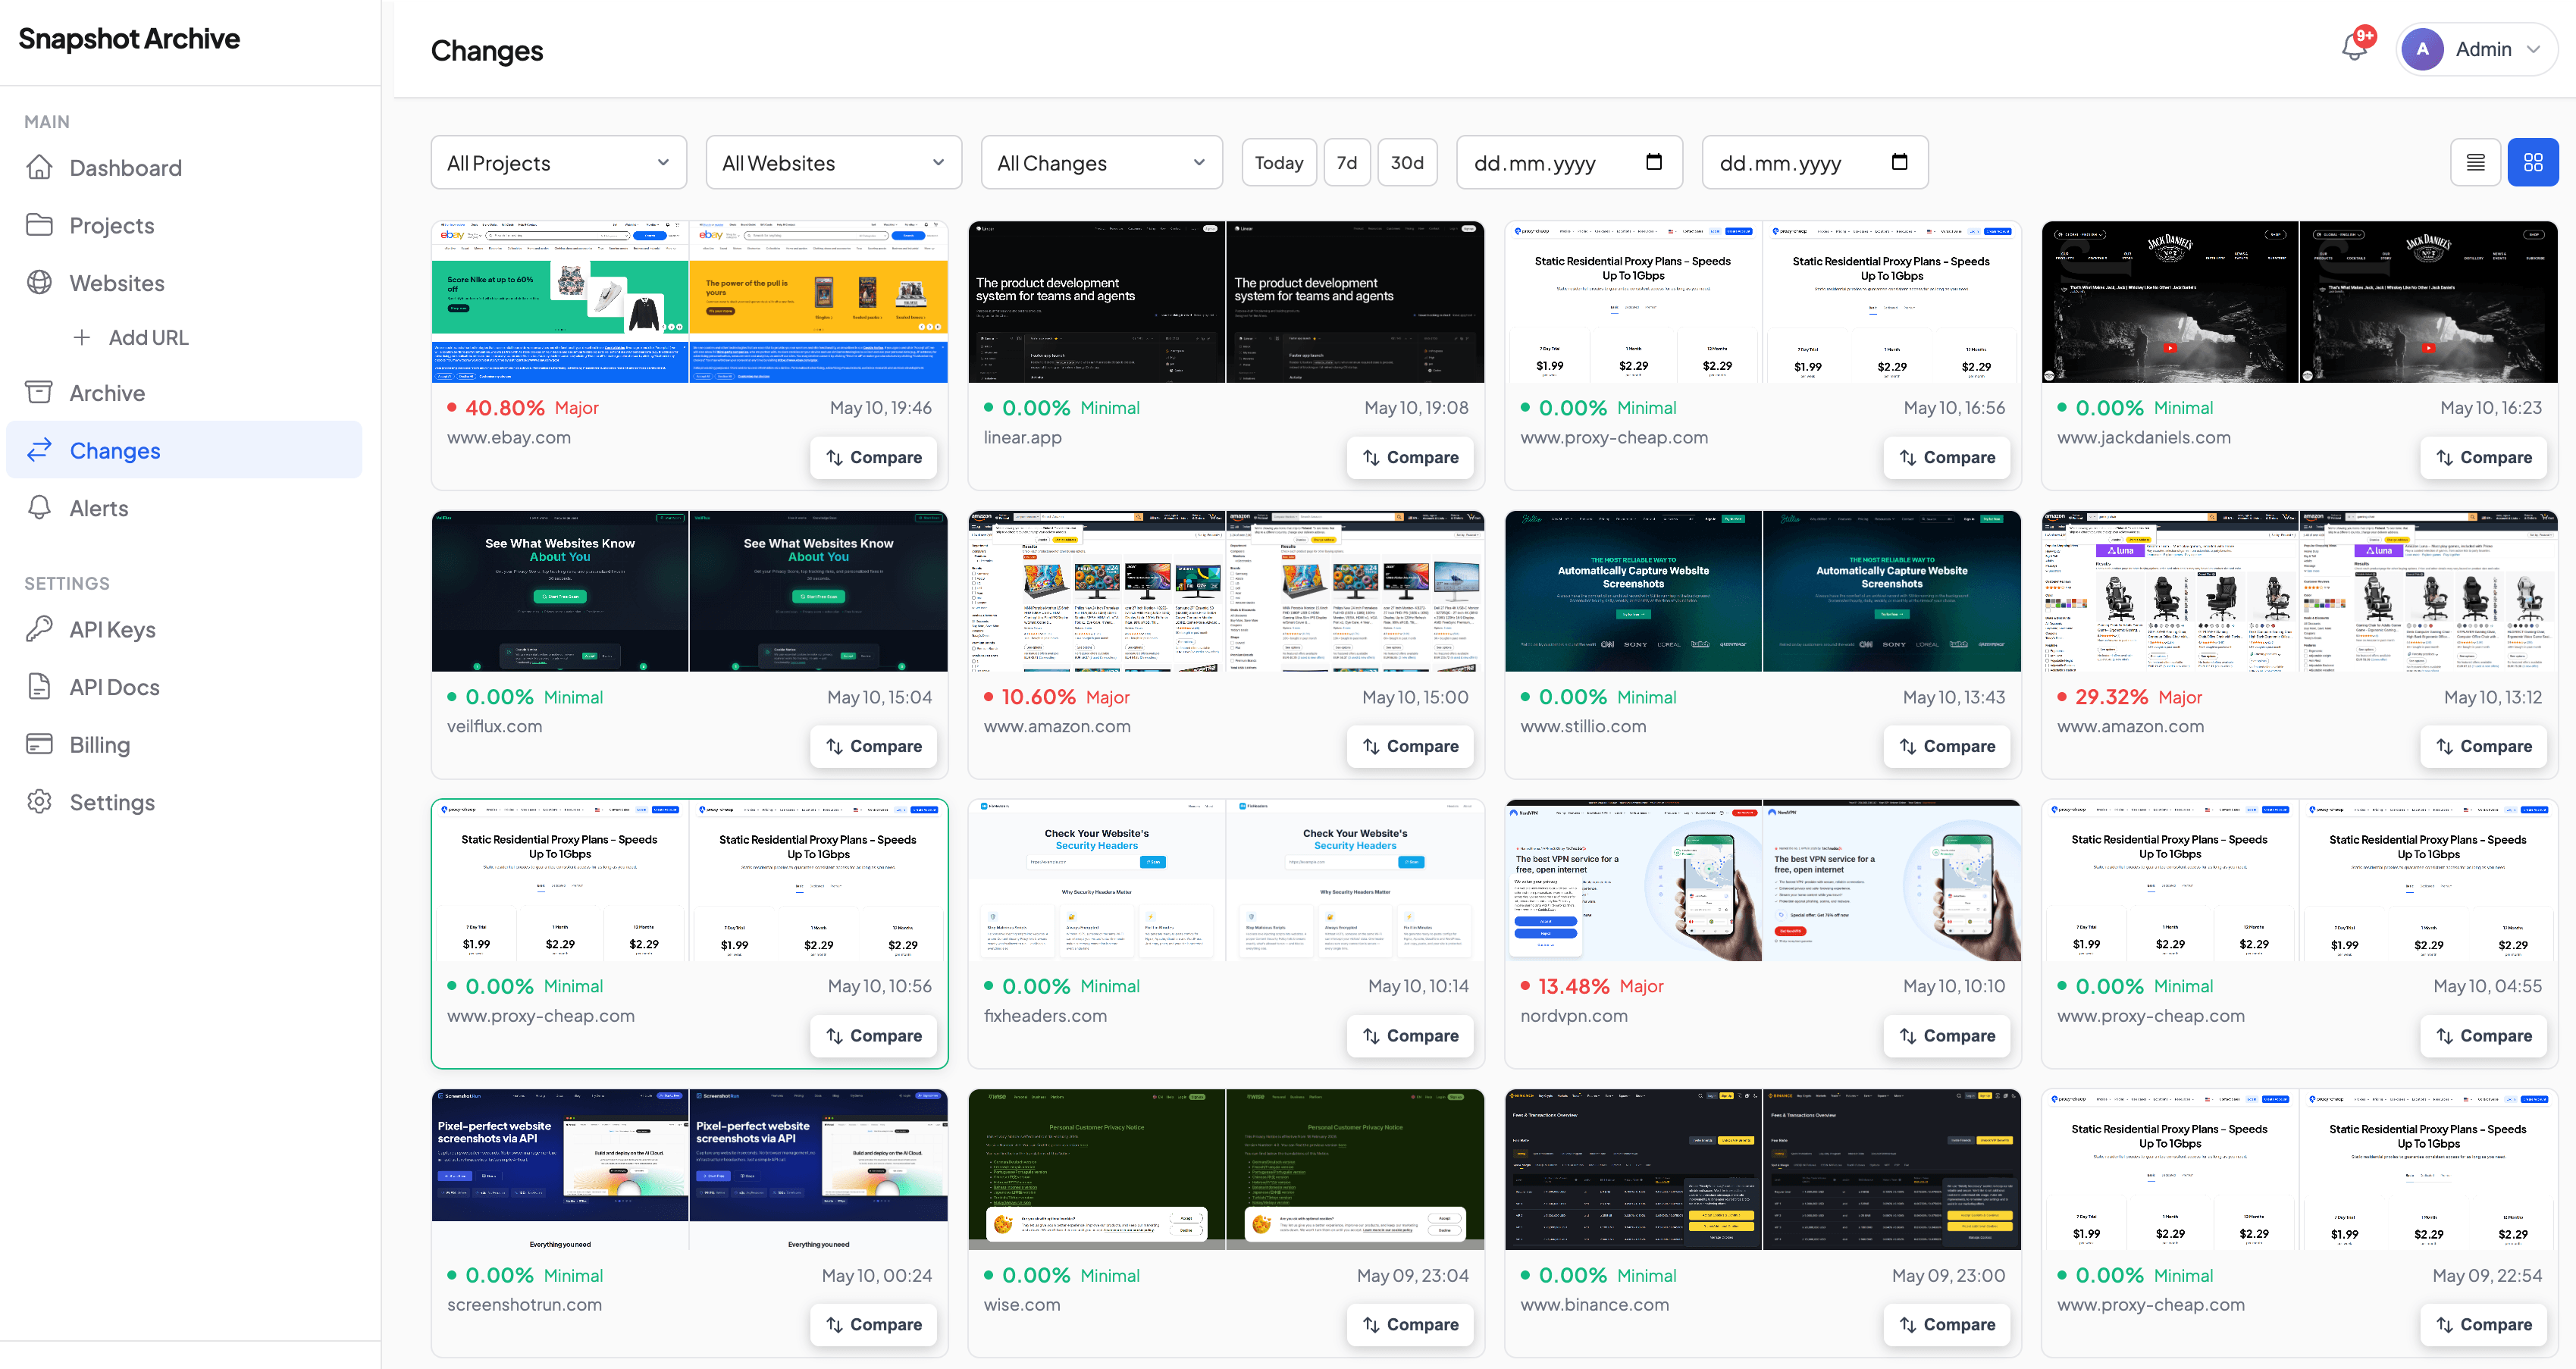
Snapshot Archive captures screenshots of your pages on a schedule and compares every new capture to the previous one. When the page looks wrong — an error template, a missing product catalog, a broken checkout flow — the visual diff catches it and alerts you before customers start complaining.
Why uptime monitoring misses real outages
These aren't edge cases. They happen regularly, and traditional monitoring misses every one of them:
- Soft errors — the server returns 200, but the page displays "Something went wrong" or a generic error template
- Partial outages — header and footer load fine. The main content area? Empty, because an API call failed silently
- CDN stale cache — CloudFlare keeps serving a cached version that's hours old while the origin is down
- Third-party failures — your payment widget, chat widget, or product feed just stops loading. The page itself looks normal
- Wrong content served — a misconfigured deploy pushes the staging version live, or a redirect loop dumps visitors on the wrong page
All five return HTTP 200. Pingdom, UptimeRobot, and every other status-code checker will report them as perfectly healthy. One glance at a screenshot tells you otherwise.
How screenshot-based availability monitoring works
Set up monitors for critical pages
Add the URLs that matter most to your business: homepage, pricing page, checkout flow, product catalog, login page. These are the pages where a visual failure directly costs you revenue or trust. Use full-page capture to see the entire page, not just the viewport.
Choose your capture frequency
For website availability monitoring, frequency depends on how fast you need to know. Configure scheduled captures at the interval that matches your risk tolerance:
- Every 5 minutes — mission-critical pages (checkout, payment, signup)
- Every 30 minutes — important pages (homepage, product catalog)
- Hourly — supporting pages (blog, documentation, about)
Higher frequency means faster detection. A 5-minute interval means you'll know about a broken page within 5 minutes — not three hours later when a customer reports it.
Visual diff detects the problem
Our change detection engine compares each new screenshot to the previous one. When the page shifts from normal content to an error state, the visual diff percentage spikes — typically 40-80% change, depending on how different the error page looks from the normal page. This is screenshot-based availability detection in action.
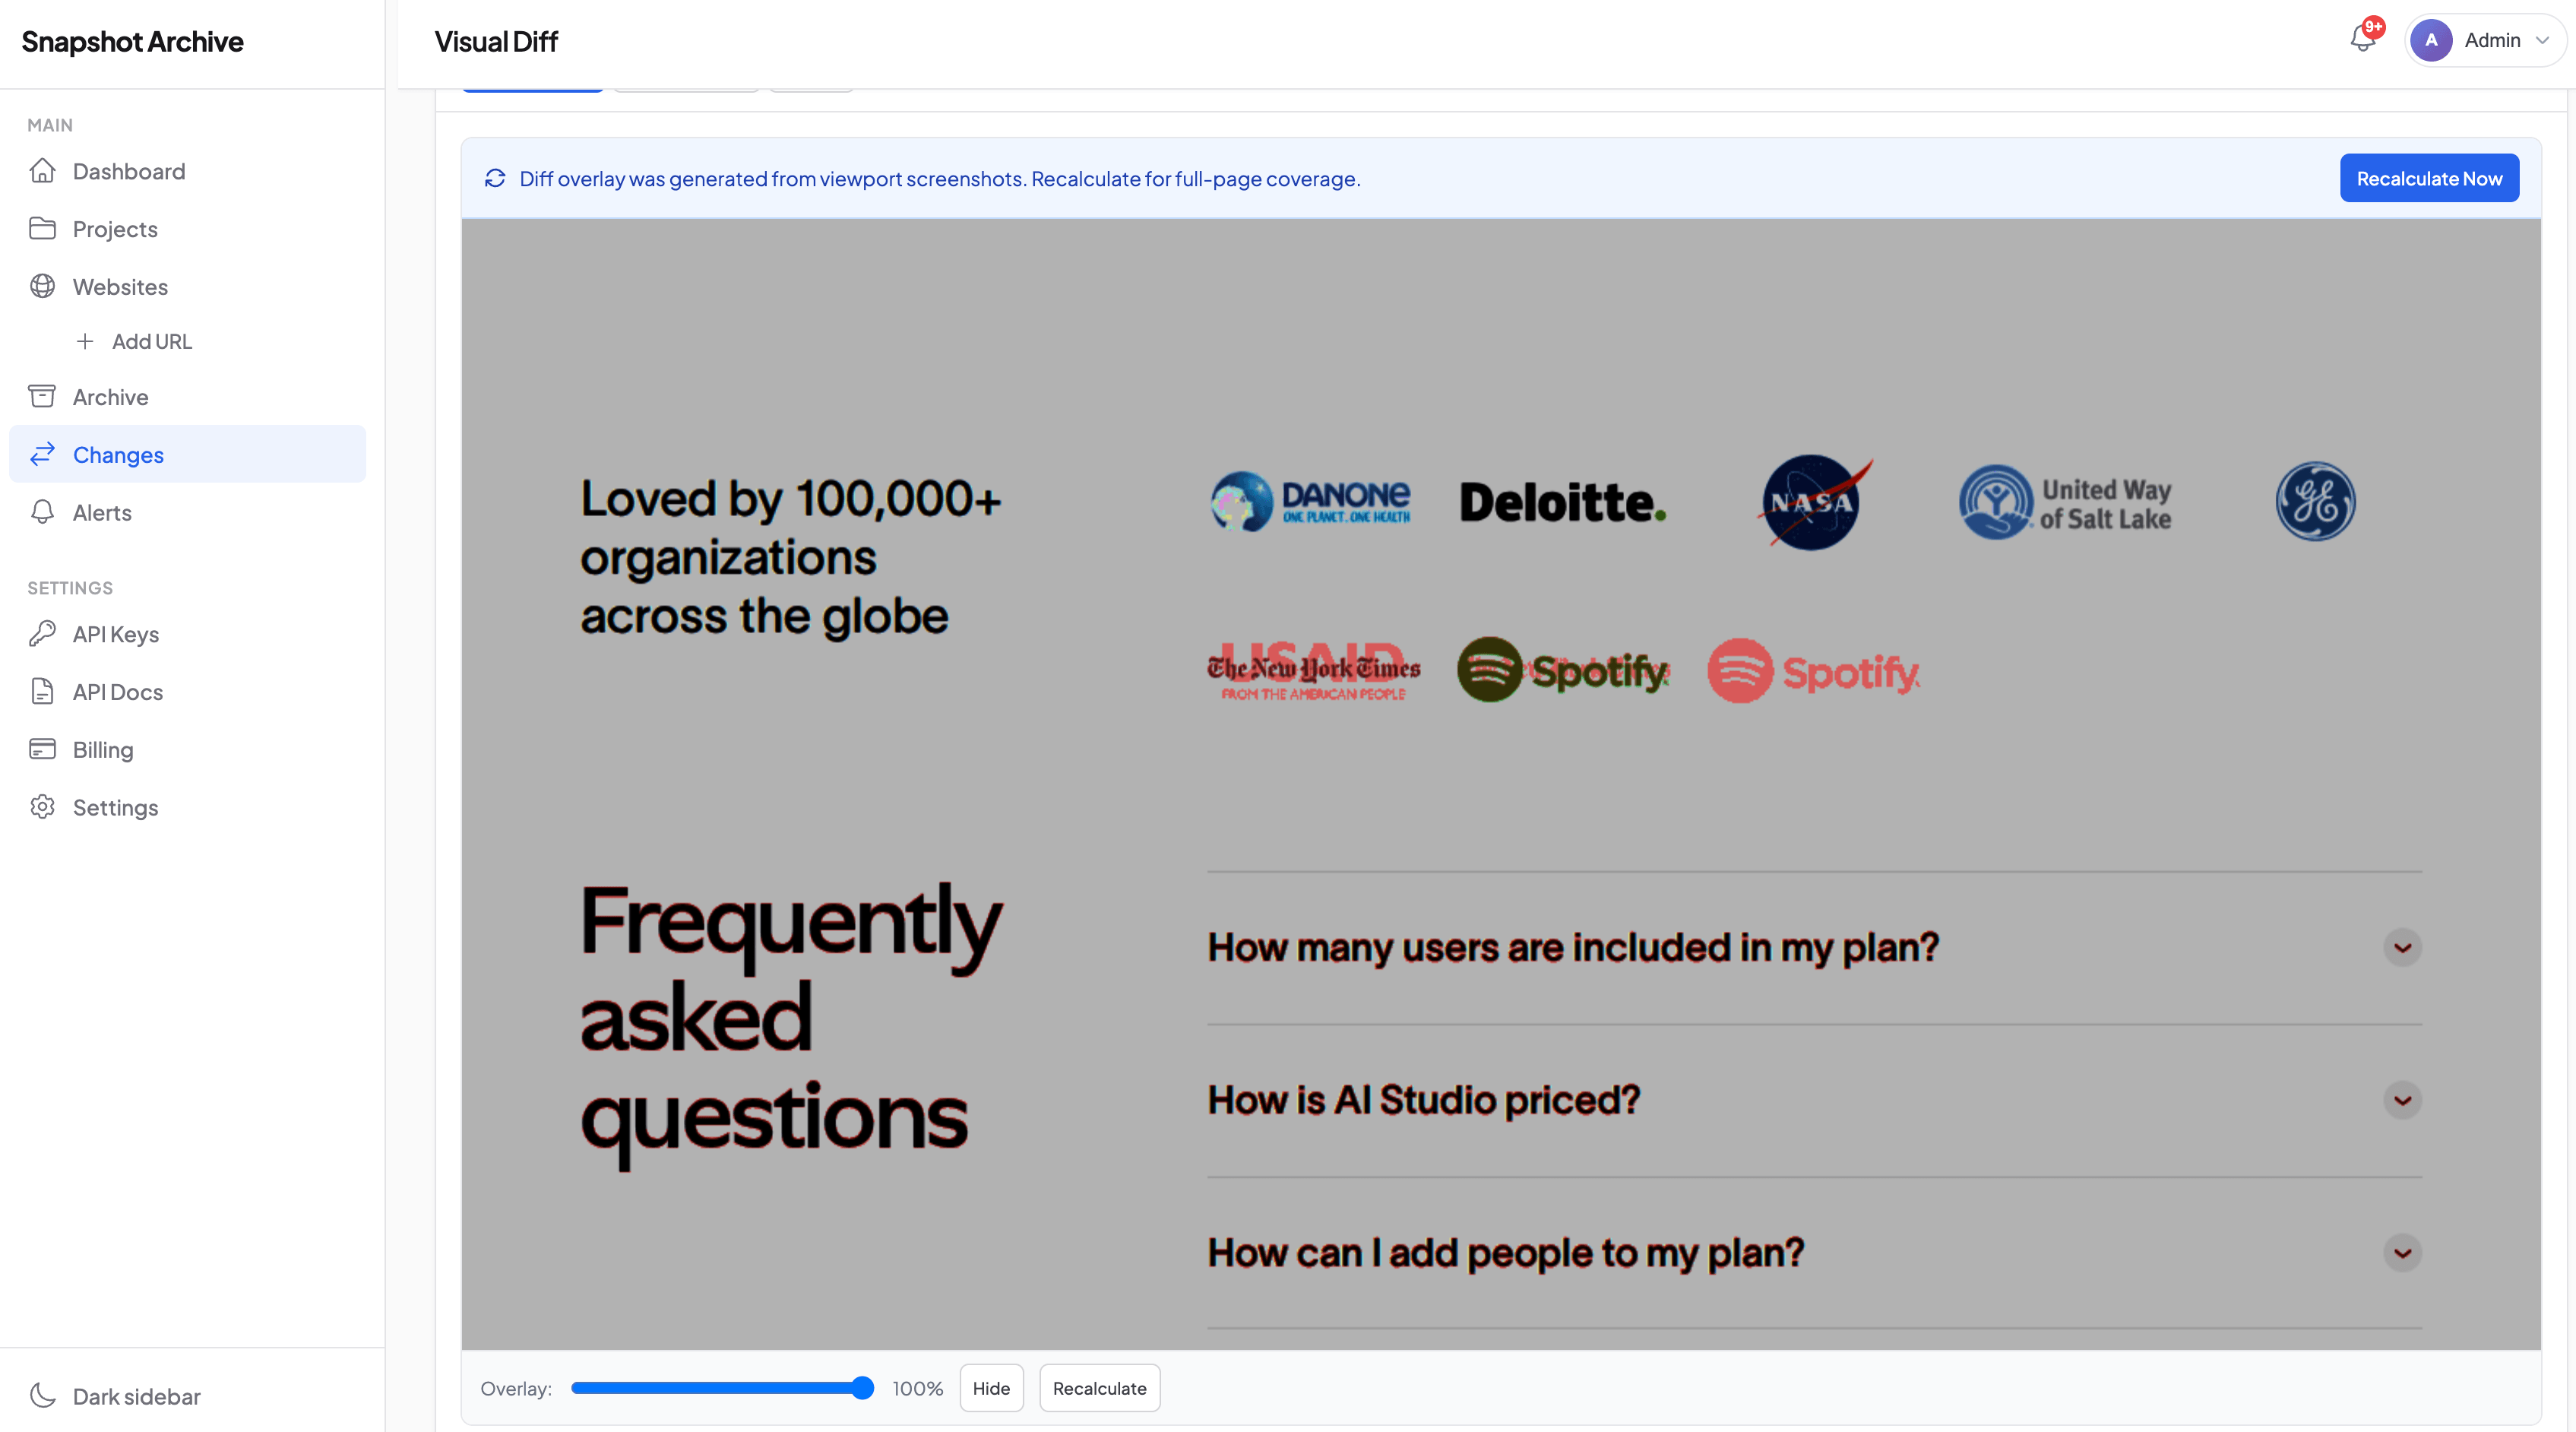
Set your alert threshold above the noise floor — typically 5-10% to filter out ad rotations and minor rendering shifts. Anything above 30% on a page that shouldn't change is almost always worth investigating. When the diff fires, you get an email with the before-and-after comparison showing exactly what happened.
Alert reaches you immediately
Change alerts notify you via email or webhook the moment a significant visual change is detected. Route the webhook to Slack, PagerDuty, or your incident management system so the right person sees it within minutes.
What visual uptime monitoring catches that status codes miss
Error pages that return 200
The most common scenario. Your application catches an internal error and renders a friendly "We're experiencing issues" page with an HTTP 200 status. Your uptime monitor sees "all green." Your customers see a broken experience. The screenshot diff catches the swap immediately.
Broken deploys
A deployment goes out at 2 AM. The CSS doesn't load, or the JavaScript bundle fails, or a template renders with missing variables. The server is healthy — it's serving the page — but the page is unusable. Your visual diff lights up with a 60%+ change that no status code would have flagged. Read more about post-deployment monitoring workflows.
Third-party service failures
Your page loads fine, but the embedded payment form or product recommendation carousel is blank. Server-side monitoring has no idea — the failure happens in the browser, after the initial response. Since Snapshot Archive renders pages in a headless browser, those missing widgets show up as a chunk of empty space that the diff flags immediately.
Content delivery issues
CDN serves a stale or corrupted version of your page. A geographic routing issue sends some visitors to the wrong regional site. A/B testing gone wrong shows a broken variant to a percentage of traffic. All of these produce HTTP 200 responses with incorrect content — and all of them are visible in the screenshot archive.
Real-world example: catching Amazon error pages during price monitoring
We discovered this pattern while tracking Amazon product pages for price monitoring. Every few days, instead of the product listing, Amazon would serve a "Sorry, something went wrong" page or a CAPTCHA challenge — both returning HTTP 200. A price scraper would either crash or silently skip the page. Our screenshot diff caught it every time because the visual change from a product listing to an error page is massive and unmistakable.
We wrote up the full story with examples — including how the error pages looked and what thresholds caught them reliably.
Setting up website availability monitoring
Which pages to monitor
Start with the pages that directly generate revenue or handle critical user flows:
- Homepage — first impression, highest traffic
- Pricing / plans page — directly impacts conversion
- Checkout / payment page — broken checkout = lost revenue
- Sign-up / login page — blocks all authenticated users if broken
- Product catalog / search results — empty results page looks like you have no products
Five to ten URLs covers most businesses. You can always add more as you go.
Recommended alert configuration
| Page type | Capture frequency | Diff threshold | Alert channel |
|---|---|---|---|
| Checkout / payment | Every 5 min | 5% | PagerDuty / Slack #incidents |
| Homepage | Every 15 min | 10% | Slack #monitoring |
| Product catalog | Every 30 min | 10% | Slack #monitoring |
| Login / signup | Every 15 min | 5% | Email + Slack |
| Blog / docs | Hourly | 15% |
Reducing false positives
Dynamic content like ads, testimonial carousels, and personalized recommendations can trigger false alerts. A few things work well here:
- Raise the diff threshold — dynamic elements rarely change more than 5-10% of the page area
- Use clip-to-element — monitor only the section that matters (the product area, not the sidebar ads). See our clip-to-element guide
- Dismiss popups before capture — cookie banners and chat widgets are the top false-positive source. Use click selectors to close them
Website availability monitoring vs traditional uptime tools
| Capability | Traditional uptime (Pingdom, UptimeRobot) | Visual monitoring (Snapshot Archive) |
|---|---|---|
| Server down (5xx) | Detects | Detects |
| DNS failure | Detects | Detects |
| Soft errors (200 + error page) | Misses | Detects |
| Broken layout / CSS failure | Misses | Detects |
| Third-party widget failure | Misses | Detects |
| Wrong content served | Misses | Detects |
| Visual regression after deploy | Misses | Detects |
| Historical visual archive | No | Yes — stored per your retention plan |
Most teams run both: a traditional uptime tool for server-level health, and Snapshot Archive for everything the server can't tell you. The table above shows why one without the other leaves gaps. If you're already using Snapshot Archive for competitor monitoring, adding your own pages takes two minutes.
Integrate website availability monitoring with your stack
Snapshot Archive's webhook alerts integrate with any incident management workflow. When a visual anomaly fires, the webhook payload includes the screenshot URL, the diff percentage, and a link to the side-by-side comparison. Route it to:
- Slack — post the before/after image directly in your incident channel
- PagerDuty — trigger an incident with visual evidence attached
- Jira / Linear — auto-create a bug ticket with the screenshot diff
- Want full control? Use the API to build your own monitoring dashboard or feed data into existing pipelines
Frequently asked questions
How is website availability monitoring different from regular uptime monitoring?
Uptime monitoring checks if a server responds. Website availability monitoring checks if the page actually looks correct. A server can respond with HTTP 200 and still be showing visitors a broken layout or a stale cached page from three days ago. Screenshot monitoring catches these because it renders the page in a real browser and compares it visually.
How fast will I be alerted to a visual outage?
As fast as your capture frequency. With 5-minute intervals, you'll know within 5 minutes. The alert fires as soon as the visual diff exceeds your threshold — no waiting for multiple failures or confirmation periods.
Won't dynamic content like ads cause false alerts?
It can, but it's manageable. Set your diff threshold above the noise floor (5-10% for most pages), use clip-to-element to monitor only the content area, and dismiss cookie banners with click selectors before capture. Most teams get it dialled in within the first week.
Can I monitor pages behind a login?
Yes. Snapshot Archive supports custom cookies and authentication headers so you can monitor authenticated pages, admin panels, and gated content.
Does this work for single-page applications (SPAs)?
Yes. Our headless browser executes JavaScript fully before capturing, so React, Vue, Angular, and other SPA frameworks render completely in the screenshot.
What's the minimum capture interval?
5 minutes on Pro and Business plans. The free plan supports daily captures, which works for non-critical pages.
Add your five most critical pages, set your alert thresholds, and you'll have website availability monitoring running in under two minutes. Most teams catch their first unexpected issue within the first week.
Frequently Asked Questions
Uptime monitoring checks if a server responds. Website availability monitoring checks if the page actually looks correct. A server can respond with HTTP 200 and still be showing visitors a broken layout or a stale cached page. Screenshot monitoring catches these because it renders the page in a real browser and compares it visually.
As fast as your capture frequency. With 5-minute intervals, you will know within 5 minutes. The alert fires as soon as the visual diff exceeds your threshold — no waiting for multiple failures or confirmation periods.
It can, but it is manageable. Set your diff threshold above the noise floor (5-10% for most pages), use clip-to-element to monitor only the content area, and dismiss cookie banners with click selectors before capture. Most teams get it dialled in within the first week.
Yes. Snapshot Archive supports custom cookies and authentication headers so you can monitor authenticated pages, admin panels, and gated content.
Yes. The headless browser executes JavaScript fully before capturing, so React, Vue, Angular, and other SPA frameworks render completely in the screenshot.
5 minutes on Pro and Business plans. The free plan supports daily captures, which works for non-critical pages.