Post-Deployment Visual Monitoring
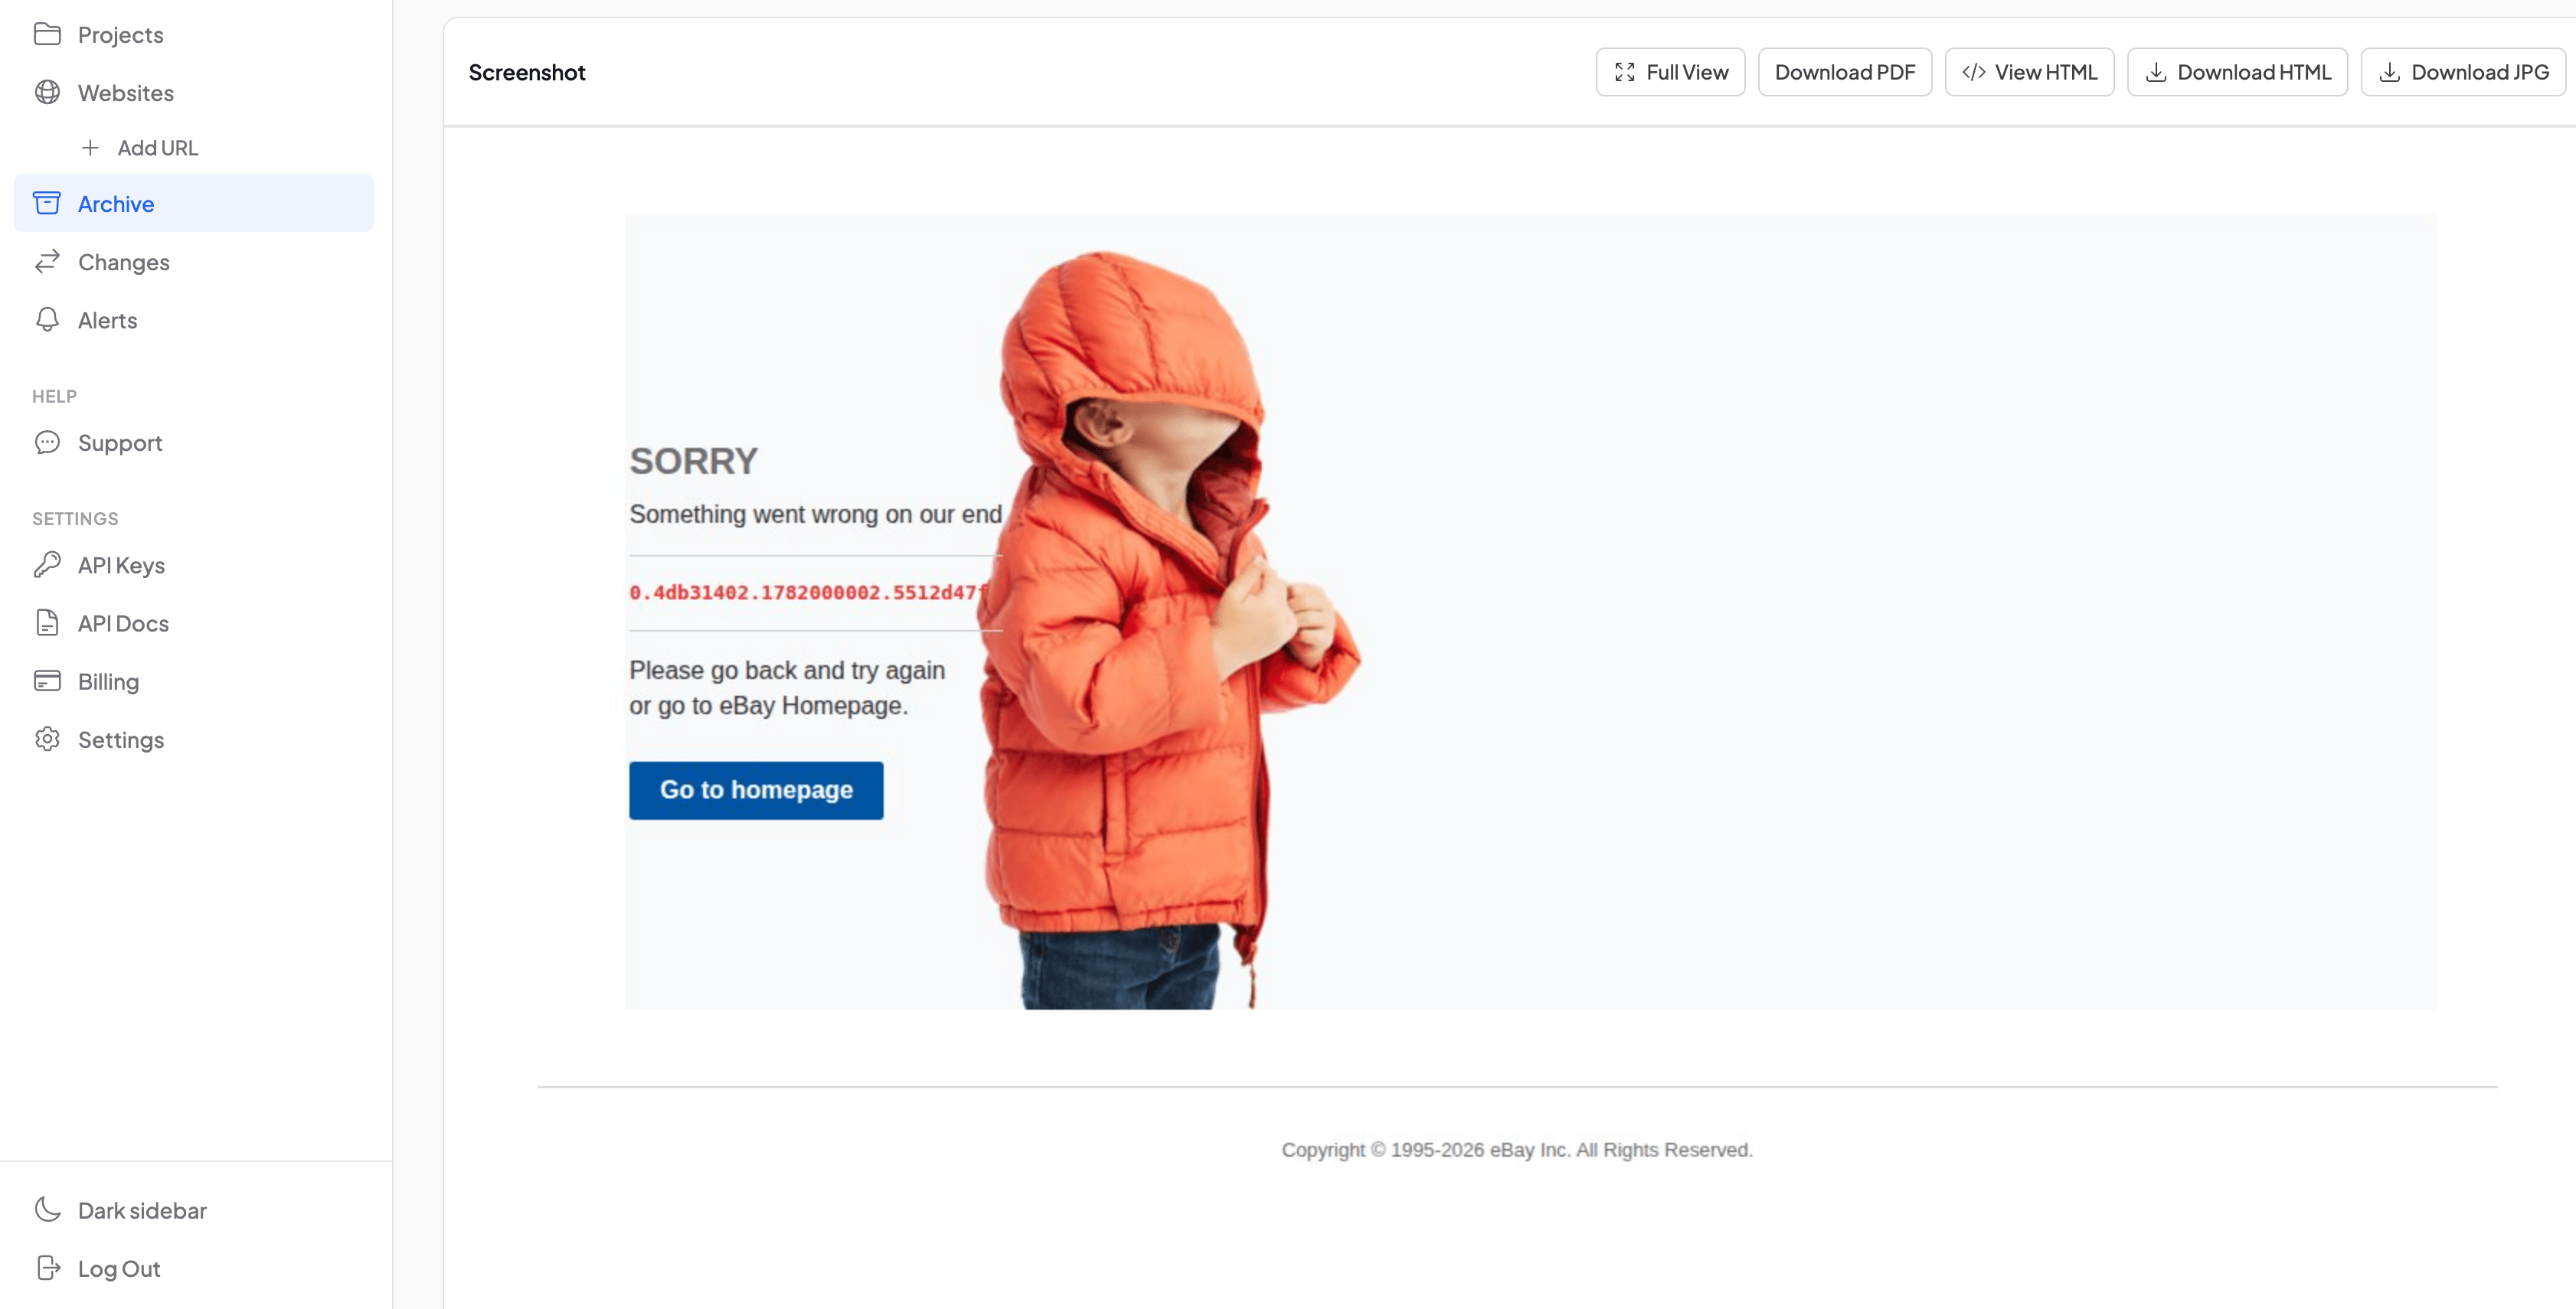
Most visual regressions after a deploy are discovered not by tools, but by users. A broken layout, a missing image, a form that slid off-screen. The server returns 200, tests pass, alerts stay silent. The problem lives in production for hours, sometimes days, until someone writes to support. By that point the damage is done: lost conversions, a ruined first impression, ad budget burned on traffic landing on a broken page.
Snapshot Archive closes that gap. Set up scheduled screenshots on your critical pages, trigger a capture after each deploy via the REST API, and let visual diff run screenshot comparison after deployment against the last known-good state. When something shifts (a missing hero image, a broken form layout, a sidebar that collapsed) you get an alert before users start filing tickets. For a deeper walkthrough of the workflow, see our guide on monitoring your website after deployment.
Why deployments break things that tests don't catch
Your test suite passed. Staging looked fine. But production runs behind a different CDN, serves a cached stylesheet from two versions ago, and loads a third-party chat widget whose script conflicts with your new code. None of these conditions exist in staging.
Visual regressions are particularly hard to detect because the HTML is often technically correct. A div renders, a button exists in the DOM, the API returns the right data. But the CSS grid broke and everything stacks vertically instead of in columns. Automated functional tests see "element present" and move on. Screenshot comparison sees the page as a browser renders it. And flags the 40% of pixels that shifted.
This is one reason teams that already use Percy or Chromatic for pre-merge visual testing still run production monitoring separately. Those tools compare component renders or staging screenshots against approved baselines before code merges. Useful for catching regressions early. But they can't tell you what happened after the deploy completed, the CDN propagated, and the cache cleared. SaaS companies running continuous deployment hit this problem weekly: staging and production diverge in ways that only show up visually.
The business cost of undetected visual regressions
The visual regressions that screenshots catch are the ones with direct business consequences. A broken CSS layout on your pricing page means visitors can't compare plans, and every hour it sits undetected costs conversions. A missing hero image on a landing page tanks ad campaign ROI because the page looks broken to every paid click. A collapsed sign-up form blocks new users entirely, and you won't know until support tickets pile up hours later.
These problems share a pattern: the server returns 200, functional tests pass, and uptime monitors stay silent. The damage is purely visual, and purely financial. Screenshot comparison after each deploy surfaces exactly these failures by flagging pixel-level changes against the last known-good state. For a technical walkthrough of common regression types. CSS conflicts, CDN cache issues, third-party script interference, see the detailed breakdown in our blog.
How to set up post-deploy monitoring in three steps
1. Add your critical pages
Start with the pages where a visual break has the highest cost: homepage, pricing page, sign-up or checkout flow, and one representative content page. Five to ten URLs covers most teams. Configure each for full-page screenshots so regressions below the fold don't go unnoticed.
2. Trigger a capture after each deploy
Use the Snapshot Archive API to fire an on-demand capture right after your deployment finishes. A single API call from GitHub Actions, GitLab CI, Bitbucket Pipelines, or a generic post-deploy webhook kicks off screenshots across all monitored pages. The call returns within seconds. Rendering and comparison happen in the background.
3. Route alerts to your deploy channel
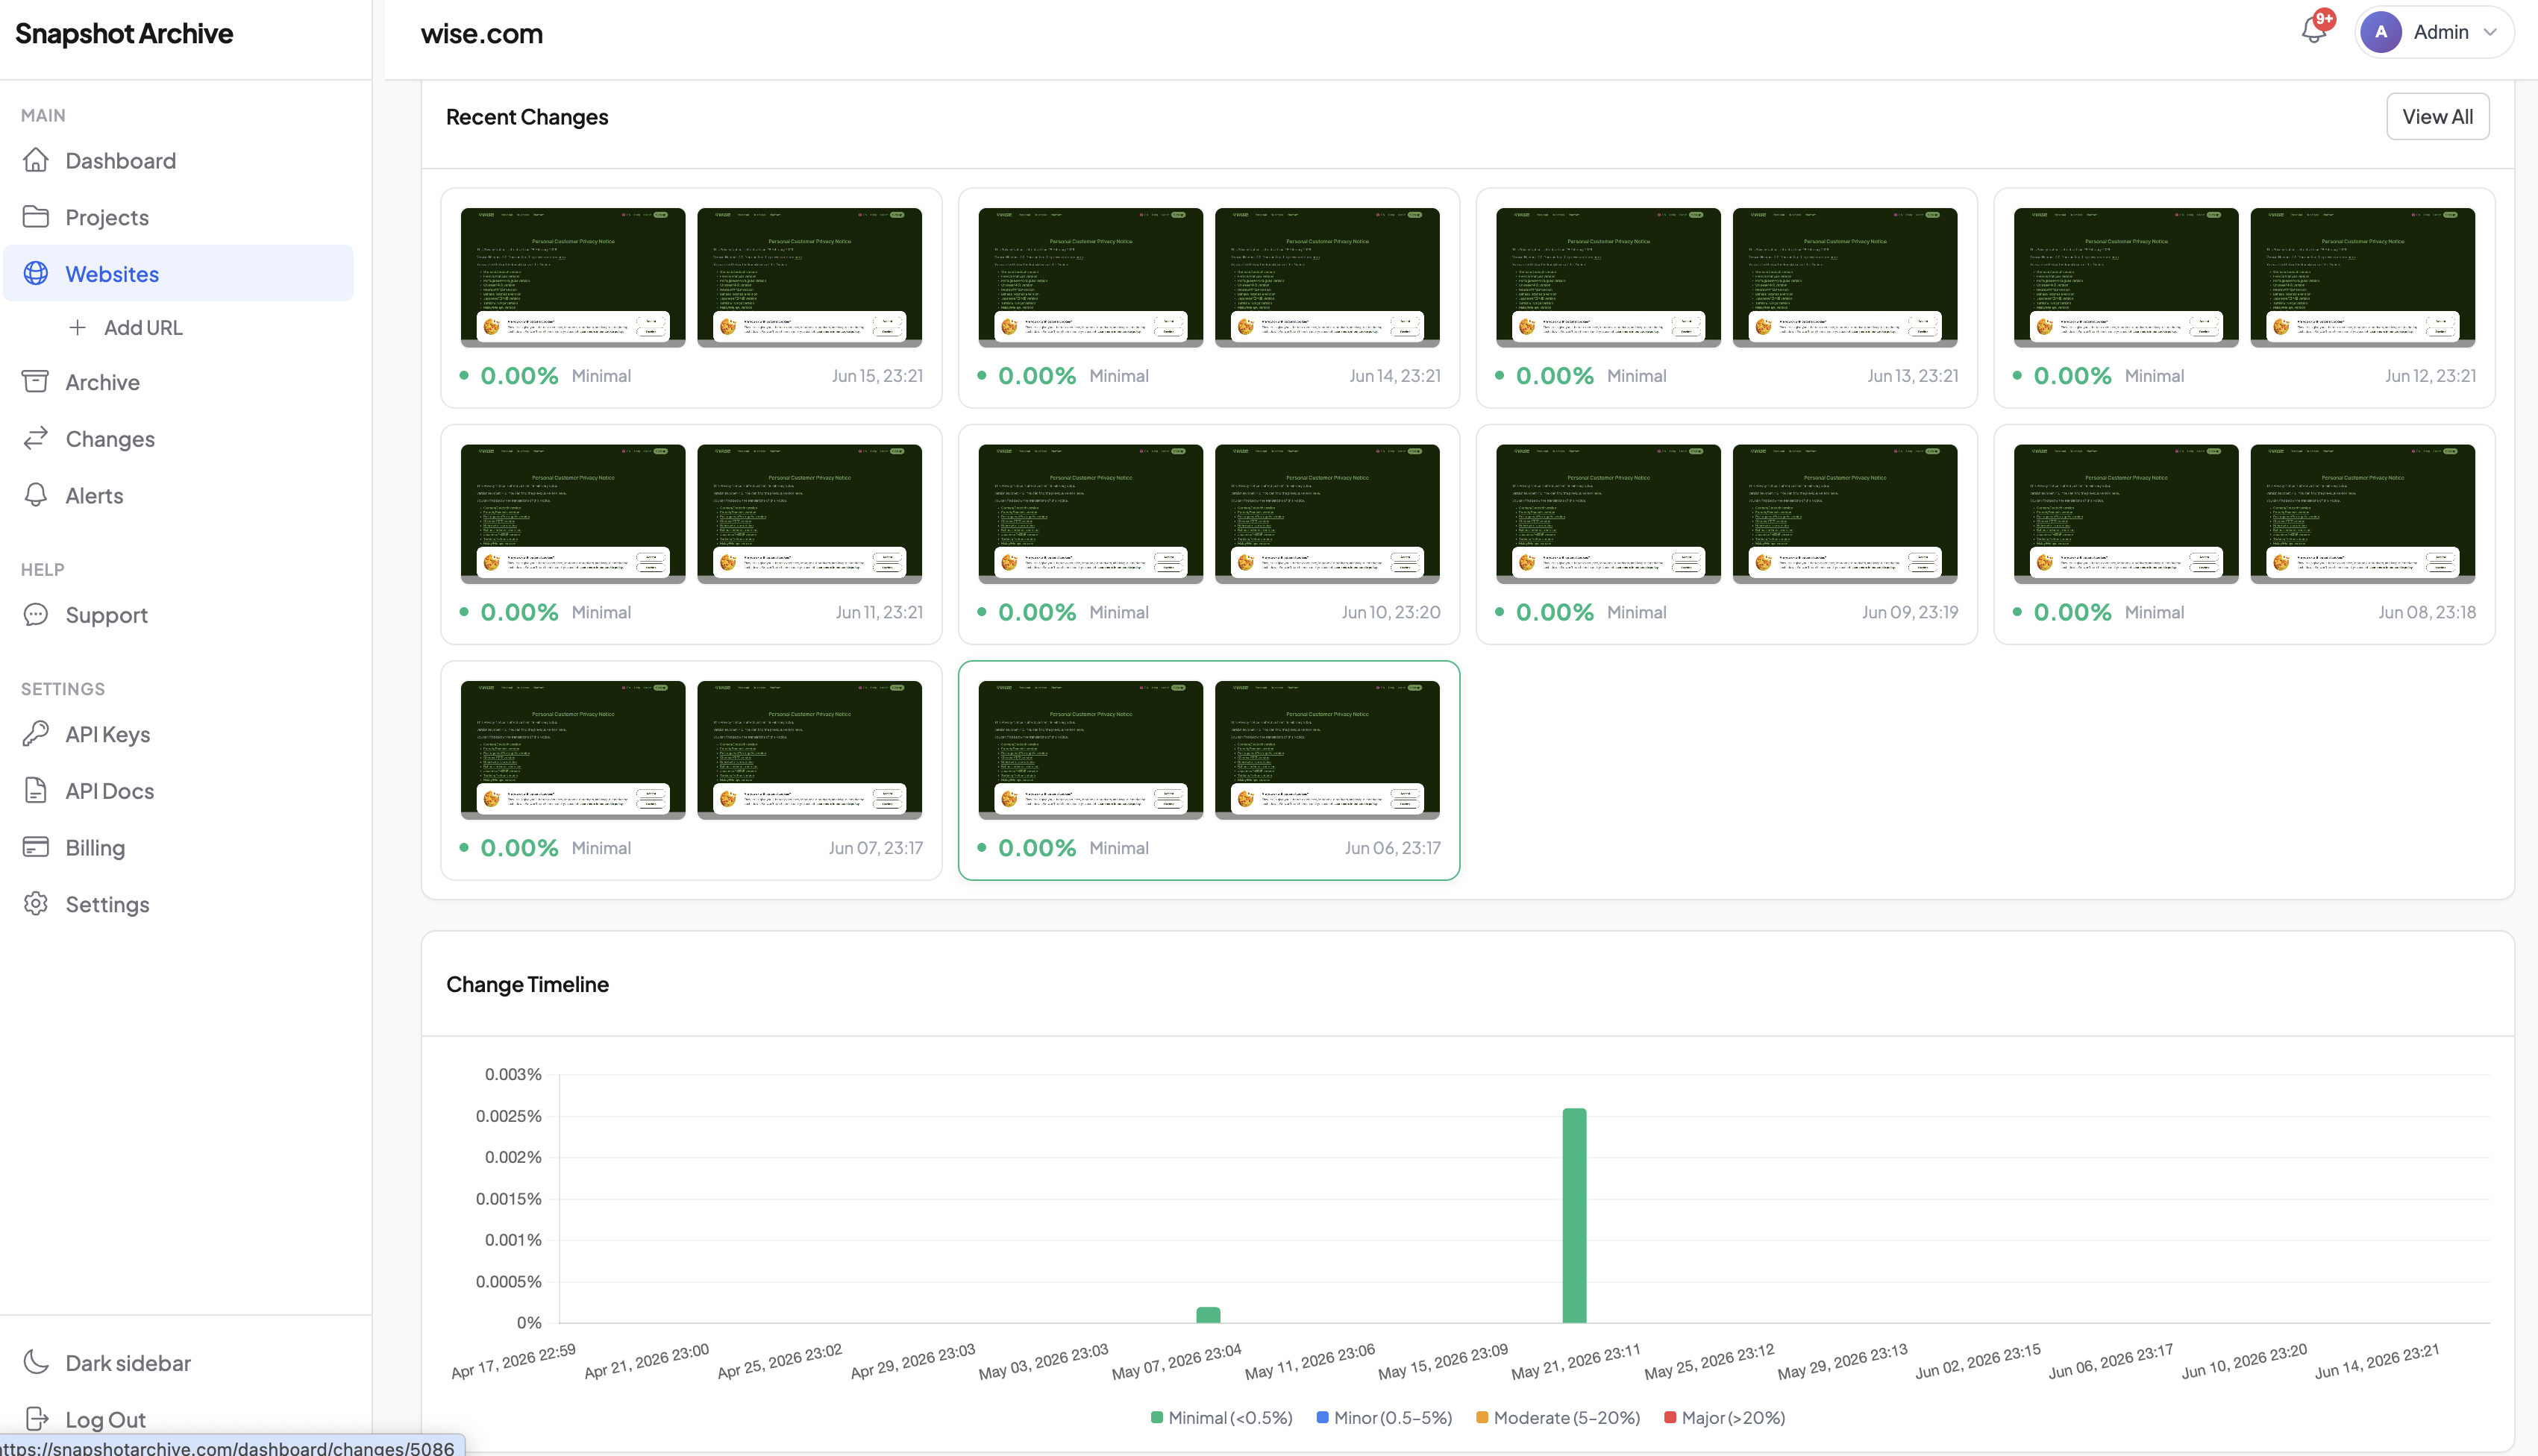
Set change alerts to notify the same Slack channel where deploys are announced. Or an email list, or a webhook endpoint. A 2-3% visual change is normal noise from dynamic content. A 15%+ swing right after a deploy almost always means something broke. Start with a 10% threshold and adjust after the first week of data.
Snapshot Archive vs. Visual regression testing tools
Percy, Chromatic, and BackstopJS are built for the CI pipeline. They capture screenshots in staging, compare against approved baselines, and block merges when something deviates. They do that well.
Snapshot Archive solves a different problem. It watches production (the actual live site your users see) after code ships. No CI integration. No test framework. No codebase access. You provide URLs, it captures them on schedule or on demand, and it flags what changed. The two approaches cover different failure modes: Percy prevents regressions from reaching production. Snapshot Archive detects the ones that only appear there.
There's a setup gap worth noting too. Percy and Chromatic require SDK integration, baseline management, and ongoing test suite maintenance. Snapshot Archive works in five minutes on any URL. Including sites you don't have codebase access to. Agencies managing client sites, QA teams monitoring third-party integrations, e-commerce teams verifying marketplace listings after platform updates: all of these use production screenshot monitoring because pipeline-based tools aren't an option.
Which pages deserve deploy-triggered monitoring
Not every page needs regression monitoring. Focus on the five to ten pages where a visual break has the highest cost, homepage, pricing or checkout, authentication flows, and one representative content page per template. Capture both desktop and mobile viewports for each. For a detailed breakdown of which pages deserve priority and why, see our guide on choosing pages to monitor after deployment.
Handling false positives after deploys
Cache propagation delays are the most common source of noise. If your capture fires immediately after deploy, the CDN might still serve old assets. Add a 30-60 second delay in your pipeline before the API call. This small wait avoids flagging stale content as unchanged. Or triggering a false alarm when the cache flips mid-render.
Dynamic content (ad rotations, personalized recommendations, live data feeds) changes between captures regardless of whether you deployed. The clip-to-element feature lets you monitor only the stable regions of a page (header, hero, navigation, footer) while excluding volatile zones. This alone cuts most false positives.
A/B tests deserve separate consideration. If your deploy activates a new experiment, the visual diff will flag it. Which is actually useful, since it confirms the variant is rendering. But if it generates unwanted alerts, exclude the experiment container from your monitoring zone. For more on tuning sensitivity, see the guide on reducing false positives in screenshot monitoring.
What your deploy archive looks like after three months
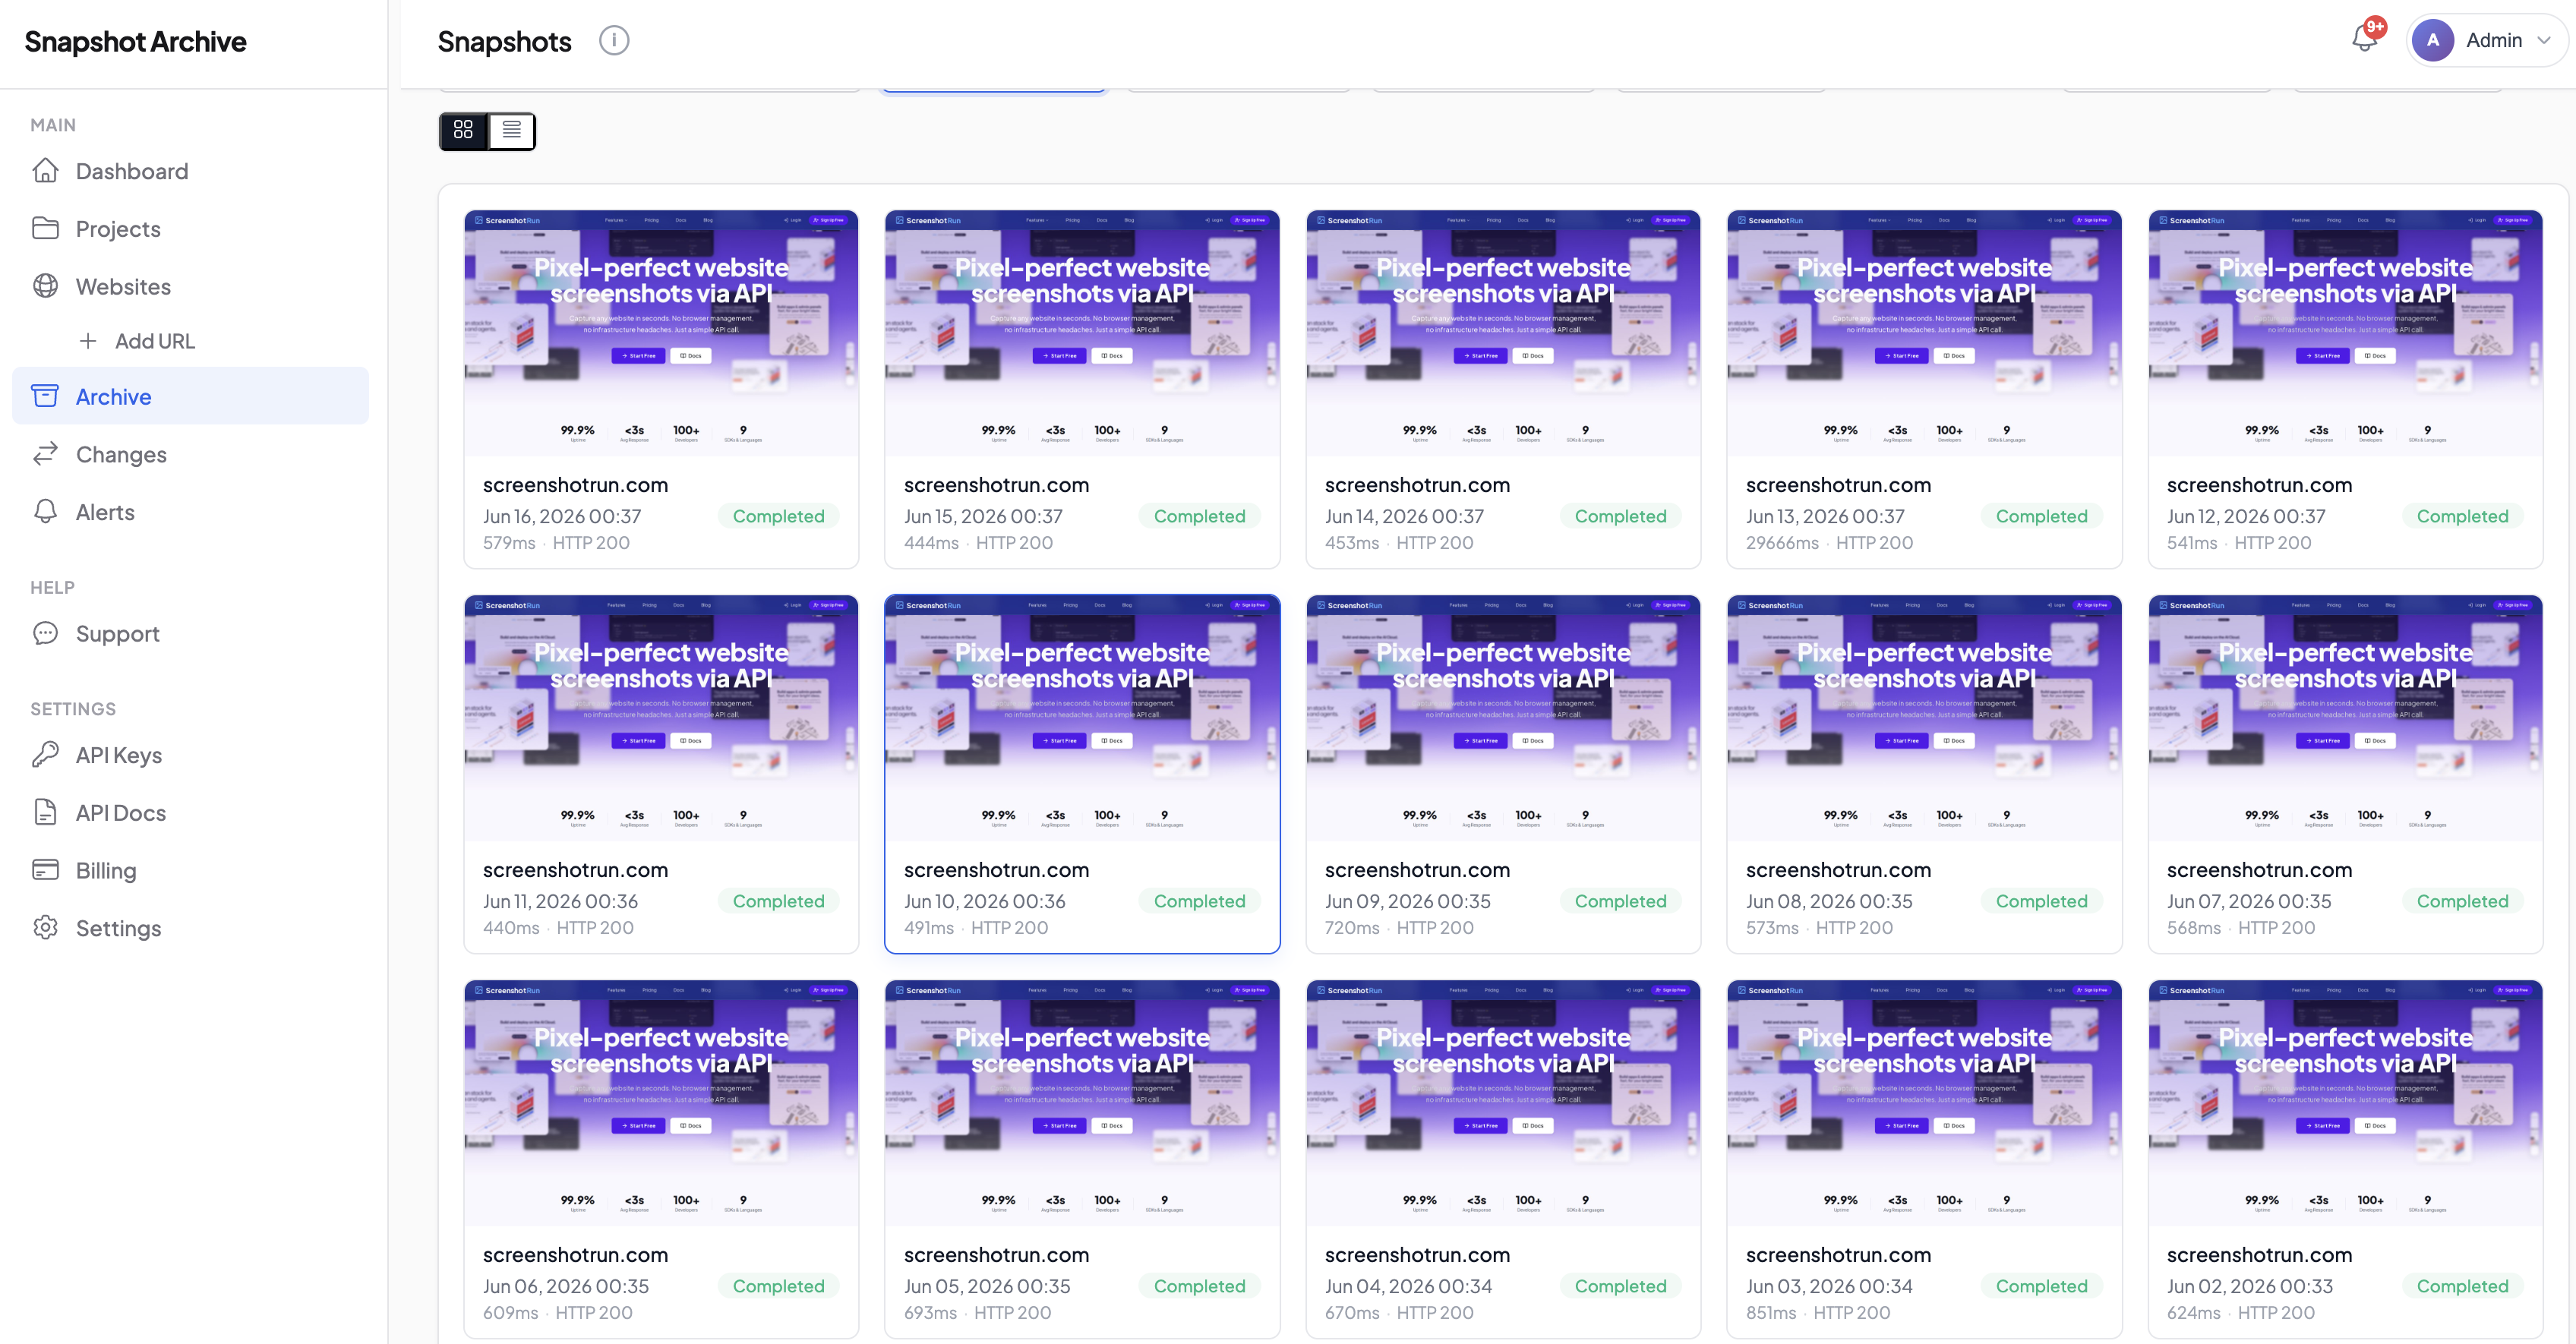
Every capture triggered by your pipeline becomes part of a timestamped visual record. After three months of daily deploys, you own a complete history of how your production site looked at each release point.
Post-mortems get more concrete. When a customer reports that "something looked wrong last Tuesday," you pull up captures from that day, identify which deploy caused the regression, and measure how long it persisted. No more reconstructing from memory or scrolling through git blame.
Design drift becomes measurable. Small CSS adjustments accumulate across dozens of deploys. Comparing this month's homepage to three months ago reveals how far the live design has drifted from the original mockup: useful for periodic design audits and stakeholder reviews.
For teams in regulated industries, this archive doubles as a compliance record. Timestamped screenshots of the live site after each deploy provide evidence that content changes were released and visually verified. The same captures that protect against regressions also satisfy audit requirements. And if you're monitoring competitor sites alongside your own, deploy-triggered captures sit next to scheduled competitor screenshots in the same dashboard, one visual record covering both your releases and the competitive picture.
Frequently Asked Questions
Post-deployment visual monitoring uses automated screenshots to capture your website immediately after each code deploy, then compares them pixel-by-pixel against the previous version. It detects broken layouts, missing images, and CSS regressions that functional tests and uptime monitors miss because the server still returns HTTP 200.
Percy and Chromatic run in your CI pipeline before code reaches production — they compare staging screenshots against approved baselines. Snapshot Archive monitors the live production site after deployment. The two cover different failure modes: CI tools prevent known regressions from shipping; production monitoring catches issues that only appear in the live environment (CDN caching, third-party scripts, environment-specific rendering).
Focus on five to ten pages where a visual break has the highest business cost: homepage, pricing or checkout page, authentication flows (sign-up, login), and one representative content page per template. Capture both desktop and mobile viewports for each URL.
Use the Snapshot Archive REST API to fire an on-demand capture after your deployment step completes. A single API call from GitHub Actions, GitLab CI, Bitbucket Pipelines, or a post-deploy webhook triggers screenshots across all monitored pages. Results and visual diffs are available within minutes.
Add a 30-60 second delay before triggering captures to let CDN caches propagate. Use the clip-to-element feature to monitor only stable page regions (header, navigation, hero, footer) while excluding dynamic content like ad rotations or personalized recommendations. Start with a 10% change threshold and adjust based on your first week of data.
Yes. Every capture becomes part of a timestamped visual record. During post-mortems you can pull up screenshots from any deploy date, identify which release caused a regression, and measure how long it persisted. The same archive serves as compliance evidence for regulated industries.